
Here’s how Richard Driehaus built his fund to last generations

Though this investment great recently passed, his legacy will live on in the mutual fund industry.
Today, we look at how Richard Driehaus, a titan of the investment industry spent years building his firm to be a highly respected boutique investment management firm. We will also take another look at the fund’s holdings heading into its new era.
In addition to examining the portfolio, we’re including a deeper look into the fund’s largest current holding, providing you with the current Uniform Accounting Performance and Valuation Tearsheet for that company.
Investor Essentials Daily:
Friday Uniform Portfolio Analytics
Powered by Valens Research
Unfortunately, Driehaus Capital Management just announced with great sadness the unexpected passing of its founder, Richard H. Driehaus.
Driehaus spent years building up Driehaus Capital Management to be the enduring boutique investment management firm it is today.
With all of his accomplishments, Driehaus was named by Barron’s as one of the 25 most influential individuals within the mutual fund industry of the past 100 years.
He will continue to be known as one of the greats in the investing world.
With a new era ahead for Driehaus Capital Management, we thought it may be worthwhile to take another look at the fund and its positions.
Below you will find our original report on the company with an updated portfolio overview and analysis.
When Mark Cuban bought the Dallas Mavericks on January 4, 2000, the team had a 240-550 record the prior 10 years.
Through the entire 1990s, the team went to the playoffs once, in 1990. They lost all 3 games in that playoff series. Mavericks fans had not seen a playoff win in over a decade when Cuban bought the team.
And yet, Cuban paid an eye watering $285 million for the franchise. At the time, no one had ever bought an NBA franchise for more than $200 million. His acquisition raised more than a few eyebrows.
Who buys one of the most poorly run franchises in the league, in a football town, for 40%+ more than anyone had ever paid for another NBA team?
But Cuban understood something important.
The Mavericks’ worth had nothing to do with their record the past 10 years. What would matter is the potential growth drivers he could unlock in the business going forward.
That would determine whether he was overpaying for a trophy asset, or he was as savvy with this purchase as he had been in building Broadcast.com and selling it to Yahoo for $5 billion.
Cuban was an avid basketball fan. He had courtside seats next to the Mavericks bench before he ever became an owner. He had done his research. He could see opportunities to unlock, to justify the value of his investment.
He saw where he would drive growth in the business, and how he could make a significant return on his investment. He was confident in betting on growth when others were just focusing on valuing the business as it was.
He started by focusing on filling up the arena. He sold seats in the nosebleeds for $8 a game to get people in the door. He knew he’d make up the money on concessions. He raised the high demand courtside seat prices 10x, from $200 a seat to $2,000. People still came, they wanted to be on TV.
Importantly, he also invested in the team itself. The way to make real money on the team wasn’t to starve the product and wait to make money on the broadcasting and ticket sales as they stood today, it was to drive growth in all sides of the business by investing to facilitate that growth.
The team had a core of Steve Nash and Dirk Nowitzki, who had both joined the team prior to Cuban buying the team. He surrounded them with the players they needed. When the team needed rebounding, he brought in Dennis Rodman, the seven-time NBA rebounding champion.
His investment yielded a return on the court. The following 10 years, the Mavericks didn’t have a losing season. They won the NBA championship in 2011. But just as importantly, his investment benefited the business’ ability to throw off revenue.
He also had great timing. Cuban purchased the team just when the industry he had made his money in, media and the internet, were making the league more international. They were also making overall fan engagement in the league stronger.
This meant bigger broadcasting deals, and new lines of revenue for the league as a whole. Lines of revenue that would trickle down to the Mavericks.
Cuban’s focus on investing in growth in the business, and his timing in riding a macro wave have led to the Mavericks value rising to $2.3 billion today, according to Forbes. That’s a 7x+ return for Cuban from his investment 19 years ago.
That is the kind of return you only can generate if you are comfortable betting on growth.
Buying a value stock, a company that is trading at 50% of its intrinsic value, can lead to a stock doubling. But it’s almost impossible to find a company that is intrinsically undervalued 7x what it is worth, based on current cash flows.
Only by finding investments that can transform their cash flows, can one generate 7x returns.
Few investors have a more impressive track record finding growth investments than Richard Driehaus. For context, in the 1980s, a dollar invested in the Russell 2000 would have turned into $4.65. For Driehaus’s fund, that same $1 would have turned into $24.65. That’s a 5x higher return.
His fund has kept on producing returns like those since.
After Driehaus read John Herold’s America’s Fastest Growing Companies, he’d embraced the idea that the best way to find companies that could massively outperform was to find companies who could grow.
As Driehaus himself said:
“One market paradigm that I take exception to is: buy low and sell high. I believe far more money is made by buying high and selling at even higher prices.”
Driehaus never troubled himself with P/Es. If a P/E is high, but the earnings growth means the company can deliver, and already is showing strong results, his fund will jump in.
He didn’t spend his time understanding what the company is worth and if it’s intrinsically undervalued. He focuses on if the company has positive operating momentum, and the ability to drive growth that can look like Cuban’s 7x return… or more.
Said differently:
“I believe you make the most money by hitting home runs, not just a lot of singles.”
Richard Driehaus
Driehaus understood, and his firm still understands, that traditional valuation metrics, and the traditional valuation process for those who use as-reported accounting metrics, is deeply flawed. And so they focus on identifying companies that those methodologies have missed.
One of Driehaus Capital’s flagship funds is the Driehaus Small Cap Growth Fund. While as-reported methodologies may distort these companies’ performance, looking at Uniform Accounting analysis can start to unlock the power of Driehaus’s strategy.
To show what we mean, we’ve done a high level portfolio audit of the Small Cap Growth Fund’s current portfolio, based on their most recent 13-F. This is a very light version of the custom portfolio audit we do for our institutional clients when we analyze their portfolios for torpedos and companies they may want to “lean in” on.
See for yourself below.
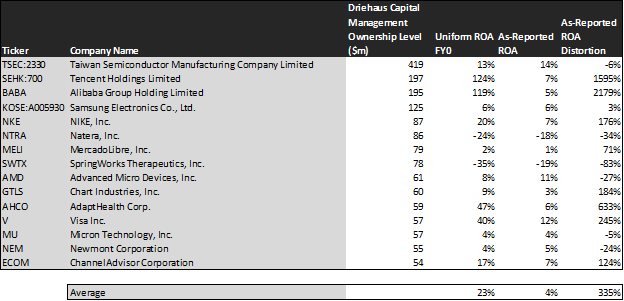
Using as-reported accounting, investors the names in this fund are poor performers. In reality, Driehaus’s fund sees through the accounting noise to pick up names markets are completely misunderstanding, often because of accounting issues.
On an as-reported basis, many of these companies are poor performers with returns below 5%-6%, and the average as-reported ROA is around 4%.
However, once we make Uniform Accounting (UAFRS) adjustments to accurately calculate earning power, we can see that the returns of the companies in Driehaus’s portfolio are much more robust.
The average company in the portfolio displays an impressive average Uniform return on assets (ROA) at 23%. This is well above corporate average returns and above what one would expect in an average distressed portfolio.
Once the distortions from as-reported accounting are removed, we can realize that Tencent (SEHK:700) doesn’t have an ROA of 7%, but returns of 124%. Tencent isn’t a low-return business as shown by wrong data.
Similarly, Alibaba’s (BABA) ROA is really 119%, not 5%. Driehaus’s focus on better accounting recognizes a high return business with robust cash flows.
AdaptHealth (AHCO) is another great example of as-reported metrics mis-representing the company’s profitability.
The company’s ROA isn’t 6%, it’s actually 47%. Uniform Accounting lines up with Driehaus’s decision making, AHCO is really a high return business.
The list goes on from there, for names ranging from Visa (V) and Chart Industries (GTLS), to Nike (NKE).
If Driehaus’s investment strategy was powered by as-reported metrics, it would never pick most of these companies, because they look like bad companies and poor investments.
To find companies that can deliver alpha beyond the market, just finding companies where as-reported metrics mis-represent a company’s real profitability is insufficient.
To really generate alpha, any investor also needs to identify where the market is significantly undervaluing the company’s potential.
Driehaus Capital is also investing in companies that the market has low expectations for, low expectations the companies can exceed.
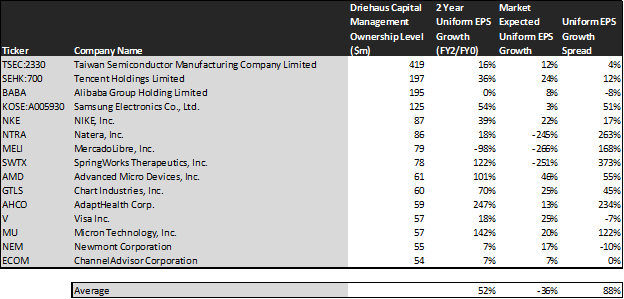
This chart shows three interesting data points:
- The 2-year Uniform EPS growth represents what Uniform earnings growth is forecast to be over the next two years. The EPS number used is the value of when we take consensus Wall Street estimates and we convert them to the Uniform Accounting framework.
- The market expected Uniform EPS growth is what the market thinks Uniform earnings growth is going to be for the next two years. Here, we show by how much the company needs to grow Uniform earnings in the next 2 years to justify the current stock price of the company. If you’ve been reading our daily analyses and reports for a while, you’ll be familiar with the term embedded expectations. This is the market’s embedded expectations for Uniform earnings growth.
- The Uniform EPS growth spread is the spread between how much the company’s Uniform earnings could grow if the Uniform earnings estimates are right, and what the market expects Uniform earnings growth to be.
The average company in the U.S. is forecast to have 5% annual Uniform Accounting earnings growth over the next 2 years. Analysts forecast Driehaus’s holdings to grow by a whopping 52%.
Even better, the market is pricing these companies to actually shrink earnings by 36% a year on average. These companies are growing faster than the market and are therefore intrinsically undervalued, with the market mispricing their growth by 88%.
These are the kinds of companies that are likely to see their stocks rally when the market realizes growth potential. Without Uniform numbers, investors cannot see the potential of these names.
One example of a company in the Driehaus portfolio that has growth potential that the market is mispricing is SpringWorks Therapeutics (SWTX). SWTX’s analyst forecasts have 122% Uniform earnings growth built in, but the market is pricing the company to have earnings shrink by 251% earnings each year for the next two years.
Another company with similar dislocations is Natera (NTRA). Market expectations call for a 245% shrinkage in earnings. However, the company is actually forecast for Uniform EPS to grow by 18% a year. Natera simply has to overcome these dour expectations to see upside.
AdaptHealth (AHCO) is yet another example. The company is priced for a 13% expansion in uniform earnings, when they are forecast to really grow earnings by 247% a year.
For the most part, Driehaus’s holdings are high quality, undervalued portfolios with businesses displaying strong earnings power. This wouldn’t be clear under GAAP, but unsurprisingly Uniform Accounting and a system built to deliver alpha see the same signals.
SUMMARY and Taiwan Semiconductor Manufacturing Company Limited Tearsheet
As Driehaus Capital Management’s largest individual stock holding, we’re highlighting Taiwan Semiconductor Manufacturing Company Limited’s tearsheet today.
As our Uniform Accounting tearsheet for Taiwan Semiconductor Manufacturing Company Limited (2330:TAI) highlights, Taiwan Semiconductor’s Uniform P/E trades at 30.3x, which is above the corporate average valuation of 25.2x and its own historical valuation of 25.0x.
High P/Es require high EPS growth to sustain them. In the case of Taiwan Semiconductor, the company has recently shown an 88% Uniform EPS growth.
Wall Street analysts provide stock and valuation recommendations that in general provide very poor guidance or insight. However, Wall Street analysts’ near-term earnings forecasts tend to have relevant information.
We take Wall Street forecasts for GAAP earnings and convert them to Uniform earnings forecasts. When we do this, Taiwan Semiconductor’s Wall Street analyst-driven forecasts are 18% EPS growth in 2021 and 13% in 2022.
Based on current stock market valuations, we can back into the required earnings growth rate that would justify TWD 610 per share. These are often referred to as market embedded expectations.
The company can have Uniform earnings shrink by 12% each year over the next three years and still justify current price levels. What Wall Street analysts expect for Taiwan Semiconductor’s earnings is above what the current stock market valuation requires in 2021 and 2022.
Furthermore, the company’s earning power is 2x the corporate average. Also, cash flows and cash on hand consistently exceeds total obligations—including debt maturities, capex maintenance, and dividends. Together, this signals a low credit and dividend risk.
To conclude, Taiwan Semiconductor’s Uniform earnings growth is in line with its peer averages, while their valuations are traded well above its average peers.
Best regards,
Joel Litman & Rob Spivey
Chief Investment Strategist &
Director of Research
at Valens Research