
Holistic investors have changed their strategy this year thanks to the displaced credit market

This investor opened my eyes to the credit world… and why all equity investors need to understand the credit market.
Today, we look at how one of my mentors built a cross-capital investment fund to generate such strong returns.
A year after we first featured this fund, significant changes have taken place in the portfolio. After the upheaval of 2020, we thought it would be useful to see how this credit giant has shifted its holdings.
In addition to examining the portfolio, we’re including a deeper look into the fund’s largest current holding, providing you with the current Uniform Accounting Performance and Valuation Tearsheet for that company.
Investor Essentials Daily:
Friday Uniform Portfolio Analytics
Powered by Valens Research
Canyon Capital Advisors, a hedge fund founded in 1990, has altered its portfolio significantly since our last write-up on the firm.
Perhaps Mitch Julis saw the writing on the wall and re-allocated the portfolio to focus on companies with balance sheets poised to survive the pandemic. Understanding the credit side of businesses is extremely important, especially when determining which companies will make it and rebound strongly coming out of the pandemic.
The At Home Revolution and Survive and Thrive themes are ones we have discussed frequently this past year. As mentioned, paying attention to credit issues is essential for these two themes.
Canyon is one of the most successful cross-capital funds in the industry, so we wanted to refresh our analysis from a year ago.
Below you will find our original report on Canyon Capital Advisors with an updated portfolio overview and analysis.
In 1999, I found myself in Las Vegas. I was 29 years old, and I had been invited to speak at a conference in Las Vegas. It was the first high-yield debt summit, at the MGM casino.
As I was preparing my presentation, I saw Mitch Julis on stage as well. I knew him as one of the conference sponsors. I didn’t know how great an investor he was and would prove to be.
I asked Mitch why he had invited me to speak at the conference. After all, I thought I was an “equity guy.”
Mitch explained it in the following way,
“Identify the accounting issues you see at the business…
The credit investors will understand what that means for the credit.”
Even more than 20 years ago, I was already heavy into this subject of not trusting the as-reported numbers.
Mitch’s advice really opened my eyes to the credit markets.
What he was saying was that the accounting distortions that equity investors need to correct to accurately understand a stock… are many of the same issues creditors need to focus on, too.
Both groups are investing in the performance of the companies. The bonds or stocks they are investing in are just derivatives of the underlying cash flows of the business.
That advice was a big contributor to why our firm today is a “cross-capital” shop. It’s why we focus on analysis on both corporate credit and equities.
Uniform Accounting lets us better understand what a company’s equity is worth. We also focus on how Uniform Accounting can help us better understand what a company’s intrinsic credit risk is, and therefore when its credit could be mispriced.
Little did I know at the time, but the person giving me that advice was an investor that Bruce Greenwald, a key advisor to Jean-Marie Eveillard’s First Eagle and a professor at Columbia University that has been referred to as “a guru to Wall Street gurus,” considers as one of the best value investors.
He’s also earned more than $150 million in a single year more than once. He and his partner appear frequently on Forbes’ list of highest earning hedge fund managers.
Mitch Julis founded Canyon Capital in 1990 with his partner Josh Friedman. Canyon is a cross-capital investing firm. The firm spends a great deal of its time investing in distressed and high yield credits, and also in equities, as it seeks to invest across the capital structure, in both equity and credit markets.
Often, Canyon is attempting to use information on a company that its analysts identify in one of the two markets to find mispriced assets in the other market, and sometimes to arbitrage the two markets.
From my experience living in the land of Wall Street research, in most, if not all sell-side firms, equity analysts and credit analysts do not communicate.
Even getting them in the same room, let alone getting them to share notes on a company, or come to a consistent opinion about a company is near impossible.
However, that creates a compelling opportunity for investors who understand how the markets interact and the information that both markets pay attention to.
That is what Canyon focuses on. Canyon doesn’t just focus on seeing information across markets, but also seeing where both markets misunderstand a company’s performance because of accounting distortions.
As Julis highlighted to me, if you can identify the real accounting performance, credit (and equity) investors should know what to do.
Julis and Canyon’s analysts know they can’t trust as-reported accounting statements.
To show how much they do not trust as-reported accounting, we’ve conducted a portfolio audit of Canyon’s top equity holdings, based on their most recent 13-F, focusing on their non-financial company holdings.
We’re showing a summarized and abbreviated analysis of how we work with institutional investors to analyze their portfolios.
Unsurprisingly, for the most part, Canyon’s research appears to line up with Uniform Accounting.
Uniform Accounting metrics highlight the company’s equity investments are much higher quality, and have higher potential, than the market and as-reported metrics imply.
See for yourself below.

Using as-reported accounting, investors might think what Canyon wants investors to think… it’s buying distressed names with low odds of turning around. In reality, Canyon sees through the accounting noise to pick up names markets are completely misunderstanding, often because of accounting issues.
On an as-reported basis, many of these companies are poor performers with returns below 5%-6%, and the average as-reported ROA is around 3%.
However, once we make Uniform Accounting (UAFRS) adjustments to accurately calculate earning power, we can see that the returns of the companies in Canyon’s portfolio are much more robust.
The average company in the portfolio displays an impressive average Uniform return on assets (ROA) at 23%. This well above corporate average returns and above what one would expect in an average distressed portfolio.
Once the distortions from as-reported accounting are removed, we can realize that Ceasars (CZR) doesn’t have an ROA of 5%, but returns of 13%. Caesars isn’t a low-return distressed company with credit woes. It is a company with robust cash flows that Canyon thinks is misunderstood by both equity and credit investors.
Similarly, Dell Technologies’ (DELL) ROA is really 122%, not 2%. Canyon’s focus on better accounting and credit analytics recognizes a high return business with cash flows to handle obligations.
Bausch Health Companies Inc. (BHC) is another great example of as-reported metrics mis-representing the company’s profitability.
Bausch Health’s ROA isn’t 3%, it’s actually 45%. Uniform Accounting lines up with Canyon’s decision making, BHC is really a high return business with ability to service its credit obligations.
The list goes on from there, for names ranging from Ardagh Group (ARD) and ViacomsCBS (VIAC), to Howmet Aerospace (HWM) and Berry Global Group (BERY).
If Canyon’s investment strategy was powered by as-reported metrics, it would never pick most of these companies, because they look like bad companies and poor investments.
To find companies that can deliver alpha beyond the market, just finding companies where as-reported metrics mis-represent a company’s real profitability is insufficient.
To really generate alpha, any investor also needs to identify where the market is significantly undervaluing the company’s potential.
Canyon is also investing in companies that the market has low expectations for, low expectations the companies can exceed.
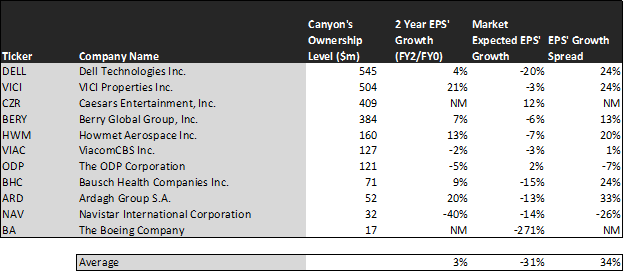
This chart shows three interesting data points:
- The 2-year Uniform EPS growth represents what Uniform earnings growth is forecast to be over the next two years. The EPS number used is the value of when we take consensus Wall Street estimates and we convert them to the Uniform Accounting framework.
- The market expected Uniform EPS growth is what the market thinks Uniform earnings growth is going to be for the next two years. Here, we show by how much the company needs to grow Uniform earnings in the next 2 years to justify the current stock price of the company. If you’ve been reading our daily analyses and reports for a while, you’ll be familiar with the term embedded expectations. This is the market’s embedded expectations for Uniform earnings growth.
- The Uniform EPS growth spread is the spread between how much the company’s Uniform earnings could grow if the Uniform earnings estimates are right, and what the market expects Uniform earnings growth to be.
The average company in the U.S. is forecast to have 5% annual Uniform Accounting earnings growth over the next 2 years. Canyon’s holdings are forecast by analysts to grow by 3%, only slightly less than the average.
Even better, the market is pricing these companies to actually shrink earnings by 31% a year on average. While these companies are growing faster than the market, they are intrinsically undervalued, as the market is mispricing their growth by 34%.
These are the kinds of companies that are likely to see their stocks rally when the market realizes growth potential. This may be the market pricing some of these companies for massive declines in profitability in distressed credit situations. Without Uniform numbers, investors cannot see the creditworthiness of these names.
One example of a company in the Canyon portfolio that has growth potential that the market is mispricing is Ardagh Group. Ardagh’s analyst forecasts have 20% Uniform earnings growth built in, but the market is pricing the company to have earnings shrink by 13% earnings each year for the next two years.
Another company with similar dislocations is Dell Technologies. This might look like a company Canyon is misunderstanding initially, with low market expectations.
Market expectations call for a 20% shrinkage in earnings. However, the company is actually forecast for Uniform EPS to grow by 4% a year. Dell simply has to overcome these dour expectations to see upside.
Yet another is the fund’s second largest holding. VICI Properties (VICI) is priced for a 3% decline in uniform earnings, when they are forecast to grow by earnings by 21% a year.
That being said, sometimes investors miss what Uniform Accounting is picking up, or in Canyon’s case, the fund might be betting on specific events for the company that make earnings forecasts less relevant.
Howmet Aerospace (HWM) is forecast to see Uniform earnings grow by 13% a year going forward. However, the market is pricing the company for a 7% annual earnings shrinkage.
For the most part, Canyon’s holdings are high quality, undervalued portfolios with businesses displaying strong earning power. This wouldn’t be clear under GAAP, but unsurprisingly Uniform Accounting and a system built to deliver alpha see the same signals.
Dell Technologies Tearsheet
As Canyon’s largest individual stock holding, we’re highlighting Dell Technologies’ tearsheet today.
As the Uniform Accounting tearsheet for Dell Technologies (DELL) highlights, Dell’s Uniform P/E trades at 9.4x, which is below the corporate average valuation of 23.5x, but around its own historical valuation of 7.8x.
Low P/Es require low, and even negative, EPS growth to sustain them. In the case of Dell, the company has recently shown a 3% Uniform EPS growth.
Wall Street analysts provide stock and valuation recommendations that in general provide very poor guidance or insight. However, Wall Street analysts’ near-term earnings forecasts tend to have relevant information.
We take Wall Street forecasts for GAAP earnings and convert them to Uniform earnings forecasts. When we do this, Dell’s Wall Street analyst-driven forecasts are 33% EPS growth in 2021 and 20% EPS shrinkage in 2022.
Based on current stock market valuations, we can back into the required earnings growth rate that would justify $74 per share. These are often referred to as market embedded expectations.
The company can have Uniform earnings shrink by 20% each year over the next three years and still justify current price levels. What Wall Street analysts expect for Dell’s earnings decline is above what the current stock market valuation requires in 2021, and in line with market expectations in 2022.
Furthermore, the company’s earning power is 20x the corporate average. Also, cash flows and cash on hand are below its total obligations—including debt maturities, capex maintenance, and dividends. Together, this signals a low credit and dividend risk.
To conclude, Dell’s Uniform earnings growth is above its peer averages, while their valuations are traded below its average peers.
Best regards,
Joel Litman
Chief Investment Strategist
at Valens Research


