
As infrastructure spending returns this is the ETF to watch

Biden just passed a historic infrastructure bill that’s going to help kickstart a massive wave of capital expenditure spending across the U.S.
That means new bridges, roads, energy solutions, airports, and broadband capabilities. It can also be great for your portfolio.
The economy was already set up for such a CapEx cycle. The new bill gives us even more confidence that investors should expose themselves to this crucial macroeconomic theme.
Also below, a detailed tearsheet of one XLI’s largest holdings.
Investor Essentials Daily:
Friday Portfolio Review
Powered by Valens Research
The country’s aging public infrastructure has long been a concern among voters and politicians. Yet little seemed to ever come about of discussions to finally spend on repairs.
That all changed this past Monday when Biden put pen to paper and signed into law one of the crown jewels of his economic agenda: The $1 trillion Infrastructure Investment and Jobs Act.
It is a massive political win for the President, who has been under fire from both parties with nosediving approval ratings.
Putting politics aside, it’s clear the infrastructure bill will provide big tailwinds for public and private investment across the U.S economy.
The money won’t just go to roads and bridges. It will also be spent on electric vehicle charging stations, broadband expansions, clean energy infrastructure, airports, public transportation, and many other crucial infrastructure needs, many of which will be tech-enabled and more advanced than ever before.
At $1.2 trillion in size, the bill amounts to an equivalent percentage of GDP that the U.S. spent on the Marshall Plan, its effort to rebuild Europe after World War II.
The bill points to what many have been calling the upcoming “CapEx cycle.”
Over the last 20 years, Corporate America’s balance sheets have gotten historically old. Thanks to the Great Recession, both local governments and businesses have been loath to invest.
However, the pandemic recovery and unprecedented demand has meant that aging infrastructure is unable to keep up with spending. This means finally that management teams are willing to spend their dollars in long-term investments once again.
Federal support on the public infrastructure side may be just the catalyst that kicks the CapEx cycle into gear.
But remember, this bill isn’t meant to turn around a fledgling industry. It is meant to add fuel to a fire that is already burning, with the hopes of realizing spending multipliers as the entire infrastructure sector booms.
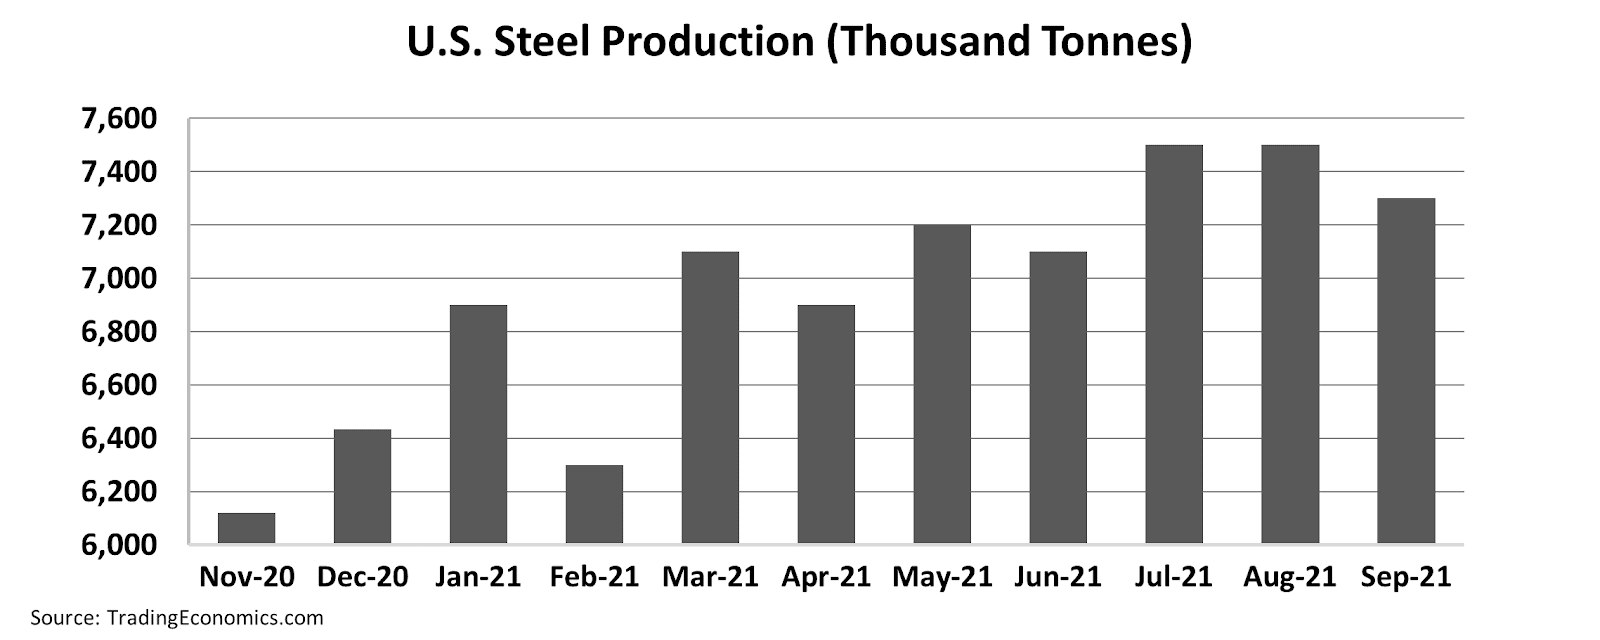
We know this because the sector is already doing well. Steel production, for example, has bounced back from the slump of the pandemic and is back at volumes last seen in 2018-2019 when the economy was humming.
See for yourself below.
As with prior CapEx cycles, industrial companies will be the most likely beneficiaries.
On both the public and private side, new capital expenditure projects will need sensors, motors, wires, and large-scale equipment. The market for these products is characterized by rising demand and constrained supply, a recipe for higher prices and higher margins.
Those who want to play the CapEx wave may want to make sure they don’t overthink it by overly exposing themselves to basic materials that are typically low-return in any environment.
It may be best to just buy those mainline big industrial firms that will inevitably hog the centerground of the spending wave. One place to look is the S&P XLI, The Industrial Select Sector SPDR Fund.
Read on to see a full Uniform Accounting analysis of the ETF’s top holdings, and learn why it is a great collection of firms to own as the economy experiences historic infrastructure spending.
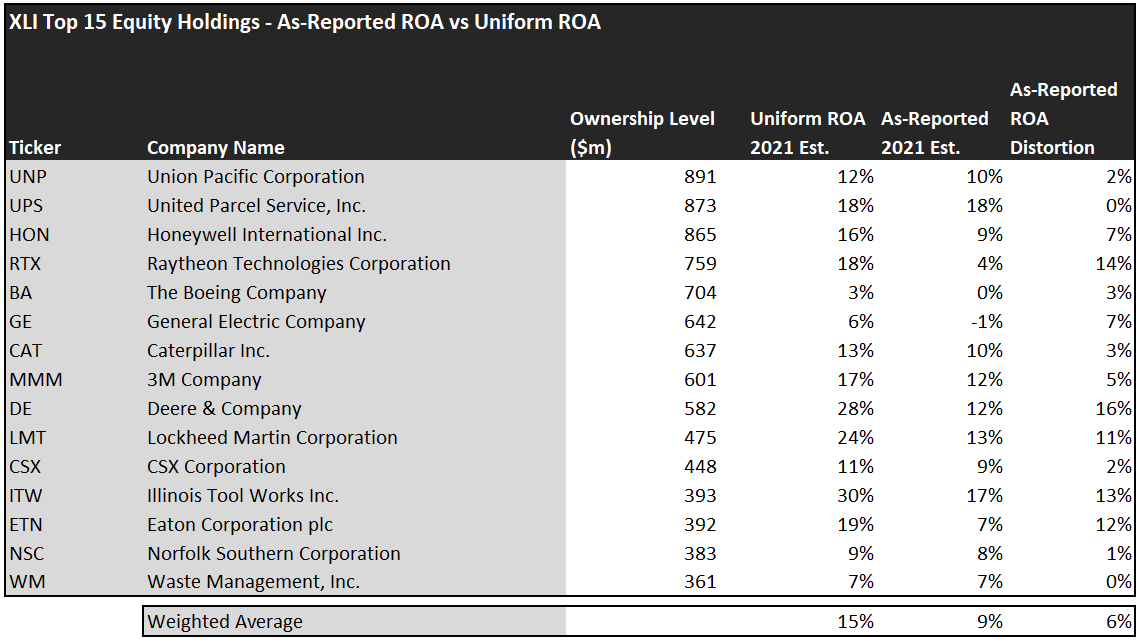
When looking at the top 15 components of XLI, most investors would be led to believe that the fund holds companies with return on assets (“ROA”) below the corporate average, with only 9% ROA. However, Uniform Accounting demonstrates that real profitability is higher.
As-reported GAAP ROA is subject to dozens of distortions that make it a useless figure for aggregate apples-to-apples comparisons. Our team at Valens uses Uniform Accounting to correct for these distortions, fixing inconsistencies with M&A accounting, goodwill, stock option compensation schemes, un-amortized R&D accounting, and non-recurring special items, among other line items.
We only look at the line items that matter for the operations of a business, and make appropriate treatments to those that don’t.
After making adjustments, we can see that these companies are actually more profitable than they seem, with 15% Uniform ROA.
For example, take a look at Illinois Tool Works (ITW). Although the company reports 17% ROA, its asset base is overinflated with lingering goodwill from old acquisitions. This goodwill serves no productive purpose, and has nothing to do with the firm’s operations. After removing goodwill and making several other adjustments, we see that Uniform ROA is actually 30%, making ITW the most profitable company in this list.
Similarly, take a look at Raytheon (RTX). On a GAAP basis, the company appears to return below the cost of capital. However, this is a consequence of special items on the income statement that are non-recurring and are not representative of business operations. Once adjusted, Uniform ROA is much higher, at 18%.
But investors need to remember… Finding companies that perform well is a common and important first step in investing, but it does not hold the key to finding alpha.
Investors need to find those companies that perform well, but are priced to perform poorly. Without the visibility of Uniform Accounting, this may be difficult to quantify. But thanks to our team’s Embedded Expectations Analysis, we can see exactly what a company is priced to do.
The chart below compares analyst-expected returns with market-expected returns. When there is a severe dislocation between the two, it can often mean the market is failing to understand something about a company. See for yourself:
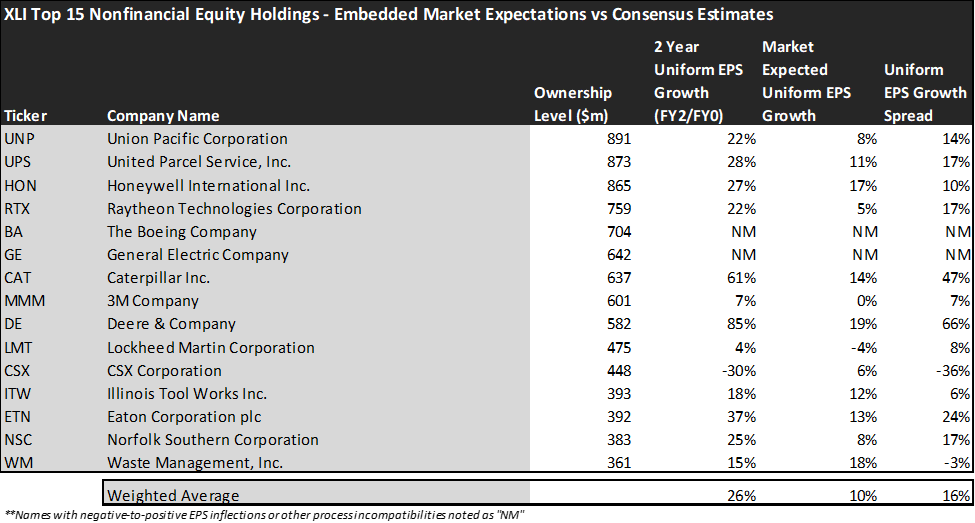
This chart shows three interesting data points:
- The 2-year Uniform EPS growth represents what Uniform earnings growth is forecast to be over the next two years. The EPS number used is the value of when we take consensus Wall Street estimates, and we convert them to the Uniform Accounting framework.
- The market expected Uniform EPS growth is what the market thinks Uniform earnings growth is going to be for the next two years. Here, we show by how much the company needs to grow Uniform earnings in the next 2 years to justify the current stock price of the company. If you’ve been reading our daily analyses and reports for a while, you’ll be familiar with the term embedded expectations. This is the market’s embedded expectations for Uniform earnings growth.
- The Uniform EPS growth spread is the spread between how much the company’s Uniform earnings could grow if the Uniform earnings estimates are right, and what the market expects Uniform earnings growth to be.
Based on these companies’ valuations, the market is pricing in 10% Uniform EPS growth over the next two years. This is reflective of expectations for the upcoming CapEx cycle, as average corporate EPS growth is 5%.
Analysts, however, are even more optimistic. Their foresight into the industry, which tends to be of higher quality and accuracy compared to the market at large, yields expectations for 26% Uniform EPS growth.
For example, take a look at the fund’s largest holding, Union Pacific Corporation (UNP). While the market is expecting the company to grow its Uniform EPS by 8% over the next two years, analysts are forecasting a nearly three-times larger expansion in earnings.
As America’s railroads form the transportation backbone of the company, and there will be an increased need to transport materials and equipment from place to place to facilitate large construction projects, United Pacific will likely be able to leverage its regional monopolies to increase its rates and margins.
In summary, XLI demonstrates that industrials are favorably positioned as we head into the CapEx cycle.
The dislocation between analyst-expected EPS growth and market-expected EPS growth sets these stocks up to surprise investors to the upside.
Embedded Expectations Analysis is a powerful tool that has worked for the team here at Valens, as the top ten highlight picks on our Conviction Long List have historically beat the market by 13%.
See how the research process here at Valens can put you ahead of the market. Learn more about getting access to the Conviction Long List here, or our quantitative list, the QGV 50, here.
Read on to see a detailed tearsheet of one XLI’s largest holdings.
SUMMARY and Honeywell International Inc. Tearsheet
As XLI’s third-largest individual stock holdings, we’re highlighting Honeywell International Inc. ‘s tearsheet today.
As the Uniform Accounting tearsheet for Honeywell International Inc. (HON:USA) highlights, its Uniform P/E trades at 33.0x, which is above the global corporate average of 24.3x but around its own historical average of 33.7x.
High P/Es require high EPS growth to sustain them. In the case of Honeywell, the company has recently shown a 27% Uniform EPS decline.
Wall Street analysts provide stock and valuation recommendations that, in general, provide very poor guidance or insight. However, Wall Street analysts’ near-term earnings forecasts tend to have relevant information.
We take Wall Street forecasts for GAAP earnings and convert them to Uniform earnings forecasts. When we do this, Honeywell’s Wall Street analyst-driven forecast is for EPS to grow by 40% and 16% in 2021 and 2022, respectively.
Based on the current stock market valuations, we can use earnings growth valuation metrics to back into the required growth rate to justify Honeywell’s $221.01 stock price. These are often referred to as market embedded expectations.
The company is currently being valued as if Uniform earnings were to grow 17% annually over the next three years. What Wall Street analysts expect for Honeywell’s earnings growth is above what the current stock market valuation requires both in 2021 and in 2022.
Meanwhile, the company’s earning power is 2x the long-run corporate averages. Furthermore, cash flows and cash on hand consistently exceed total obligations—including debt maturities, capex maintenance, and dividends. Together, these signal low credit and dividend risk.
Lastly, Honeywell’s Uniform earnings growth is above peer averages, and the company is also trading above its average peer valuations.
Best regards,
Joel Litman & Rob Spivey
Chief Investment Strategist &
Director of Research
at Valens Research


