
Institutional investors fail one of the basic value investing principles – this macro indicator shows why

Some individual investors look at institutions to get a pulse on the market. Large institutions often are the driving force between price swings, so knowing if they are buying or selling is helpful to stay current.
Today’s indicator helps us figure out if we are near any market tops or bottoms and how to interpret institutional market flows.
Investor Essentials Daily:
The Monday Macro Report
Powered by Valens Research
The model 60/40 portfolio has been a popular solution for decades. This ‘one size fits all’ portfolio has an allocation of 60% equities and 40% bonds.
The goal of the portfolio is to diversify across the economy and in asset classes. Bonds tend to be less volatile than equities, and during times of market volatility, they will keep performance from having spikes in either direction. They also offer a bit of interest income too.
Although the 60/40 portfolio has performed satisfactorily since its inception, plenty of financial professionals have deemed it to be dead. The current research on this strategy tells how this allocation is no longer effective.
Some investors are concerned the portfolio is not able to generate high enough returns. This is in large part due to perception that the large bond allocation is dragging down returns. Bond yields have been declining and are far lower than in the 1980s and 1990s when the 60/40 portfolio was at its peak in popularity.
Additionally, some investing professionals are turned off by the correlation between bonds and stocks. Macroeconomic conditions and company fundamentals affect both bonds and stocks. However, as interest rates get closer and closer to zero, bonds and stocks start acting more alike.
Because of this, during periods of panic, both asset classes move in tandem, defeating the purpose of the diversified portfolio approach. During the initial market panic in March, prices for both asset classes tumbled as there were fears about growth and liquidity.
Yet, many retail investors and institutions still employ the strategy, and with reason, as its negatives appear to be greatly exaggerated.
The strategy performed well last year. As this article highlights, the 60/40 portfolio had a higher return than the global hedge fund index, and was in line with the performance of the S&P 500. This simple framework isn’t as bad as it is made out to be.
However, it does warrant mentioning that it could be customized per user.
Here at Valens we believe in a slightly altered approach. We think the 60/40 portfolio method should be optimized for when the investor needs to access their funds. For those who don’t need to access most of their money for a long term, an 80/20 allocation may make more sense. For others who need to access more of their funds sooner, the ideal portfolio might be 30/70.
Nonetheless, the 60/40 portfolio has shown resiliency and it continues to have a strong pull on the institutional investing community.
The 60/40 portfolio is so widespread, it can even impact market returns. This is because many institutions need to rebalance their portfolios monthly to keep a correct allocation. If equities had a great month, investors need to sell stocks and buy bonds to sustain their desired allocation. This means the 60/40 institutional portfolio tends to sell into strength.
At the same time, human nature causes actively managed portfolios to sell when stocks are cratering. After all, someone has to be selling when stocks, or bonds, are dropping to cause them to drop.
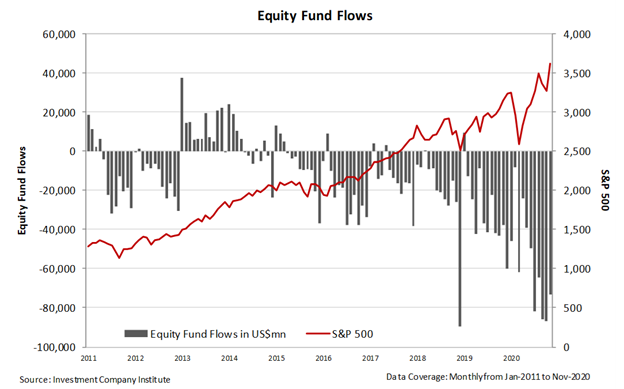
Due to these patterns, equity fund flows can help tell where market tops and bottoms are.
Equity fund flows measure the net inflow or outflow into equities. Folks might assume institutional investors are able to time the market and sell high and buy low.
However, this is rarely the case. A variety of factors impact the stock market. Politics, interest rates, investor sentiment, and a plethora of other events can cause volatility. This is why a plethora of tools are needed to evaluate market health.
Past patterns in volume and stock price can be one of those tools to help us gain insights. At market tops, passive portfolio rebalancers will often be sellers. At the market bottom, active investors will likely be big sellers as capital is pulled out of the fund.
The equity fund flows chart from the past decade confirms this trend.
Two of the biggest outflows took place when active investors were skittish. However, both times the market shot up higher soon after.
In December of 2018, active investors were panicked about the trade war with China, rising interest rates, whether the Trump tax cuts were inflating companies’ earnings, and whether we were about to tip into a recession.
Additionally, in March of last year, there was a large outflow. Investors were worried about the pandemic causing waves of companies to fail and economies dipping into deep recessions.
Looking back, both of these events were signs of capitulation. When active investors panic and bail out, it is a sign of a market bottom that can give investors confidence to buy the dip.
At the same time, the major selling which occurred in August and September, as the market was rallying, might have been a sign it was only a short-term top. The fact that the selling was happening during the rally says it was just programmatic trading to keep that 60/40 portfolio steady, as opposed to investors panicking.
It also signals that active investors aren’t piling into the market to offset those 60/40 rebalancers, which could be a sign of euphoria, and reason to be concerned about the market.
The market is moving higher because fundamentals justify it should. Its ability to move higher even while fund flows are rebalancing away from it highlights the strength of the market’s tailwinds, and should give investors comfort to continue to ride the rally.
Best regards,
Joel Litman
Chief Investment Strategist
at Valens Research


