
“Invest in what you know” and GARP—an investing legend put this fund on the map, UAFRS shows if the fund still has his magic touch

One of the most revered mutual fund investors of all time produced massive returns by embracing simple mantras like “buy what you know,” understanding the ideas behind GARP, and focusing on big winners.
Since he left, the fund has mostly produced middling performance. But in the midst of the pandemic, its performance versus peers and its benchmark has bounced back.
Using as-reported metrics, it’s not clear the fund’s short-term success will be sustainable. However, using Uniform Accounting, we can understand if the fund’s newest manager is applying the rules of this investing great in a way that might make performance more sustainable.
In addition to examining the portfolio, we’re including a deeper look into the fund’s largest current holding, providing you with the current Uniform Accounting Performance and Valuation Tearsheet for that company.
Investor Essentials Daily:
Friday Uniform Portfolio Analytics
Powered by Valens Research
Few investing mantras are as simple as:
“Invest in what you know”
And yet, a mantra that simple set off one of the most impressive track records in history.
When Peter Lynch took over the Fidelity Magellan fund as a 33 year old in 1977, it had less than $20 million in assets under management.
By the time he stepped away from day-to-day management of the fund in 1990, between his 29% a year annualized rate of return and demand to invest in the fund, the fund had turned into a $14 billion behemoth.
Peter Lynch helped truly put Fidelity on the map with his track record.
One of Lynch’s core philosophies was that people were experts in specific fields—that they worked in, the things they did in their lives, etc. If people paid attention to trends in the things around them, they’d be likely to identify trends before institutional investors necessarily could, and could outperform them.
The classic example often given of this for Lynch himself was his investment in Dunkin’ Donuts, an investment that produced massive returns for the Magellan fund.
Lynch started analyzing Dunkin’ after realizing how much he preferred the brand’s coffee versus alternatives and how popular the business was. When the rest of his fundamental analysis passed snuff, he bought in.
Among the other philosophies that helped Lynch produce such an impressive return was his flexibility about understanding how to value companies. Many investors are value investors or growth investors. Lynch helped push the idea of Growth at a Reasonable Price, or GARP investments.
He wouldn’t just look for deep-value names, or high-growth names, but rather those that were growing impressively, while also trading at a discount to what that growth warranted.
After Lynch left, the fund’s performance started to decline, before eventually frequently producing uninspiring returns the past 15 years. It appears the portfolio managers (PM) who followed Lynch didn’t have his touch and process.
However in the midst of the pandemic-driven sell-off and subsequent rally, the Magellan fund appears to once again be on top. So far in 2020, the fund is at the top of its peer group and comfortably outperforming the market.
Could it be that Magellan’s new PM has returned to Lynch’s GARP and “invest in what you know” roots has set the fund up to have another long run of outperformance?
We’ve conducted a portfolio audit of Magellan’s top holdings, based on its most recent 13-F
We’re showing a summarized and abbreviated analysis of how we work with institutional investors to analyze their portfolios.
Unsurprisingly, as-reported metrics of Magellan’s investments make it look like the fund is not focusing on the strong companies, with strong growth, in knowable areas that Lynch might have preferred. In reality, these investments appear to be exactly those kinds of names, once Uniform Accounting metrics are reviewed.
It’s clear that when Magellan is making its investment decisions, the team is making decisions based on the real data.
See for yourself below.
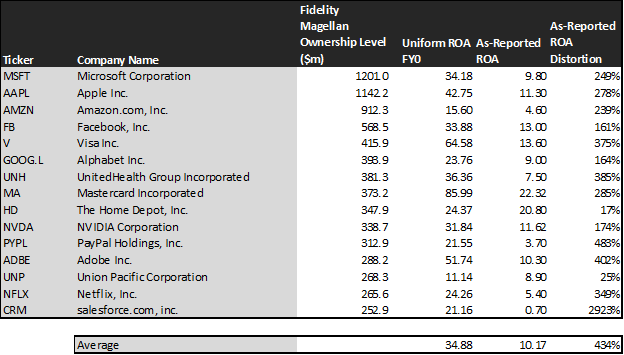
Using as-reported accounting, investors would think Magellan was buying anything other than high quality businesses positioned for opportunity that someone knowledgeable in a space would recommend.
On an as-reported basis, many of these companies are poor performers with returns at 9% or below, and the average as-reported return on assets (ROA) is right at 10%.
In reality, the average company in the portfolio displays an impressive average Uniform ROA at 35%.
Once we make Uniform Accounting (UAFRS) adjustments to accurately calculate earning power, we can see these are the kind of high quality GARP names that Lynch might have liked and Magellan is meant to focus on.
Once the distortions from as-reported accounting are removed, we can realize that Amazon (AMZN) doesn’t have a 5% ROA, it is actually at 16%.
Similarly, Mastercard’s’ (MA) ROA is really 86%, not 22%. While as-reported metrics are portraying the company as a decently profitable business, Uniform Accounting shows the company’s real robust operations.
Salesforce.com (CRM) is another great example of as-reported metrics mis-representing the company’s profitability.
Salesforce doesn’t have a 1% ROA, it is actually at 21%. Magellan appears to understand that investors viewing this as a company without a compelling moat, thinking it’s a weak business, are completely incorrect.
The list goes on from there, for names ranging from Adobe (ADBE) and PayPal (PYPL), to UnitedHealth (UNH), Visa (V), and even Apple (AAPL).
If Magellan were focused on as-reported metrics, it would never pick most of these companies because they look like anything but companies the fund is focused on.
But it appears that Magellan is making a broader bet than just on high-quality firms. It is also focused on companies that can generate significant growth.
It wouldn’t necessarily be apparent when looking at the as-reported metris, but Uniform Accounting metrics paint a complete picture of the fund’s investment philosophy.
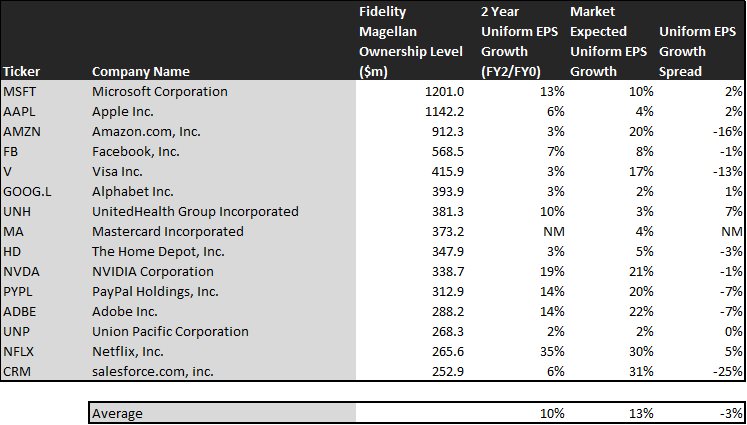
This chart shows three interesting data points:
- The 2-year Uniform EPS growth represents what Uniform earnings growth is forecast to be over the next two years. The EPS number used is the value of when we take consensus Wall Street estimates and we convert them to the Uniform Accounting framework.
- The market expected Uniform EPS growth is what the market thinks Uniform earnings growth is going to be for the next two years. Here, we show by how much the company needs to grow Uniform earnings in the next 2 years to justify the current stock price of the company. If you’ve been reading our daily analyses and reports for a while, you’ll be familiar with the term embedded expectations. This is the market’s embedded expectations for uniform earnings growth.
- The Uniform EPS growth spread is the spread between how much the company’s Uniform earnings could grow if the Uniform earnings estimates are right, and what the market expects Uniform earnings growth to be.
The average company in the US is forecast to have 5% annual Uniform Accounting earnings growth over the next 2 years. Magellan’s holdings are forecast by analysts to grow double that, growing at 10% a year the next 2 years, on average.
While the company’s are not intrinsically undervalued on average, the fund is picking up on the mantra of focusing on companies that can deliver real growth going forward, to become ten-baggers or more.
On average, the market is pricing these companies to grow earnings by 13% a year. The market is pricing these companies for growth to be 3% higher than analysts are forecasting, but the Magellan fund is betting that analysts may even be underappreciating how much these companies can grow.
One example of a high growth company in Magellan’s portfolio is Microsoft (MSFT). While the average company is forecast to have 5% Uniform earnings growth the next 2 years by analysts, Microsoft is forecast to have 13%. Importantly, the market is slightly more pessimistic too, expecting only 10% earnings growth.
Another company with similar dislocations is UnitedHealth (UNH). The company is forecast for Uniform EPS to grow by 10% a year, two times the average company. But the market is only expecting the company to deliver growth of 3% a year.
Yet another is Netflix (NFLX). The company is certainly not cheap, as it is priced for 30% growth in Uniform earnings, but the company is forecast to grow earnings even faster, by 35% a year.
That being said, as we mentioned, there are some companies that are forecast to have strong earnings growth, but the market is paying a higher premium. For these companies, like Adobe (ADBE), PayPal (PYPL), and NVIDIA (NVDA), they forecast to have earnings growth in the teens.
But market expectations are for low 20% earnings growth rates. If these companies can’t deliver on higher growth, they may disappoint.
That being said, overall, it is clear Magellan is all in on companies with strong economic moats in businesses that are understandable, and have growth potential along with the hope for some value benefits. It’s set up as a portfolio Lynch would appreciate, even if he may prefer one that was a bit more intrinsically undervalued, at least based on his teachings.
It wouldn’t be clear under GAAP, but unsurprisingly Uniform Accounting sees the same signals that Magellan says it is investing in.
Microsoft Corporation Tearsheet
As one of Fidelity Magellan’s largest individual stock holding, we’re highlighting Microsoft Corporation’s tearsheet today.
As our Uniform Accounting tearsheet for Microsoft Corporation (MSFT:USA) highlights, Microsoft’s Uniform P/E trades at 27.4x, which is above average valuation levels and historical average levels.
High P/Es require high EPS growth to sustain them. In the case of Microsoft, the company recently had a 22% Uniform EPS growth in 2019.
Wall Street analysts provide stock and valuation recommendations that, in general, provide very poor guidance or insight. However, Wall Street analysts’ near-term earnings forecasts tend to have relevant information.
We take Wall Street forecasts for GAAP earnings and convert them to Uniform earnings forecasts. When we do this, Microsoft’s Wall Street analyst-driven forecast is for Uniform EPS to grow by 21% and 5% in 2020 and 2021, respectively.
Based on current stock market valuations, we can back into the required earnings growth rate that would justify $187 per share. These are often referred to as market embedded expectations.
In order to meet current expectations for Microsoft, the company would need to have Uniform earnings grow by 10% or more each year over the next three years.
What Wall Street analysts expect for Microsoft’s earnings growth is above what the current stock market valuation requires in 2020 but is below that requirement in 2021.
Meanwhile, based on Uniform return on assets calculation, the company’s earning power is at 34%, which is 6x the corporate average. Furthermore, with cash flows and cash on hand that are above total debt obligations, Microsoft has low credit and dividend risk.
To conclude, Microsoft’s Uniform earnings growth is above peer averages, but is currently trading below peer averages.
Best regards,
Joel Litman & Rob Spivey
Chief Investment Strategist &
Director of Research
at Valens Research


