
Why investing in legacy energy companies may be a market trap

Legacy energy companies have been on a tear this year, and investors are clamoring to get exposed to the space.
But before you get too excited, let’s conduct a sober analysis of what the tailwinds really are, how long they may last, and how much of the anticipated strength has already been priced in.
In particular, we are looking at XLE, the S&P 500 Energy ETF.
Also below, a detailed tearsheet of the fund’s largest holding.
Investor Essentials Daily:
Friday Portfolio Review
Powered by Valens Research
There is one important rule of asset allocation that is frequently overlooked as investors get lost in the weeds of stock picking: The asset class, not the individual investment, matters most for long-term returns.
Said otherwise, the most explanatory factor behind long-term returns is the type of asset. These can be bonds, currencies, real estate, stocks, or anything else.
For example, imagine a REIT led by world-class management with a knack for beating the real estate market. However, when the global pandemic causes demand for office space to dry up, this hypothetical REIT will suffer regardless of the talents of the management team.
This doesn’t just apply to management teams, but investors as well. If discussing stocks, the sector that an investor chooses will dictate their returns more than the specific stocks they choose.
In fact, two cornerstone studies published in 1986 and 1991 found that sector allocation alone was able to explain 90% of fund returns across the U.S. investing universe. Subsequent studies have confirmed this relationship.
Sector ETFs allow investors to cut out the stock-picking step of the investment process entirely, and focus on whatever sector they like the most.
With oil prices seemingly shooting higher every day, investors have been clamoring to get exposure to the energy space, which can be best captured by XLE, the S&P 500 Energy ETF.
It is no surprise that XLE has shot 30% higher since the start of the year, and many are anticipating the wave of energy tailwinds to persist for some time longer. Although the story behind a particular company can change overnight, sectors are typically slower movers.
Short-lived trends can push a sector higher or lower temporarily, but longer-term trends rarely abate. The recent confidence in fossil fuel energy has certainly marked a reversal from the longer-term pessimism, but the question now is can it persist?
Step one to answering this front-of-mind question is to understand the short-term drivers. There are four in particular:
- Global post-pandemic demand for energy-intensive activities far exceeded expectations. As cars returned to the roads and consumer demand put factories into overdrive, oil and gas reserves around the world have been diminishing.
- China has entered into an oil buying spree, attempting to solve the energy crisis that has been causing rolling blackouts throughout the entire country.
- OPEC has been phenomenally reluctant to increase oil supply in the face of historic demand.
- Gunk in the global supply chain has made logistics for all industries, including oil, far more difficult. Merely the act of transporting oil and gas has become more expensive than ever, pushing prices higher.
These tailwinds are expected to keep oil prices higher than $75 per barrel for at least a year, and higher than $70 per barrel until mid-2023.
Although this may mark a short period of energy strength, investors shouldn’t forget that the current established makeup of the energy industry, which has very heavy exposure to oil and gas prices, is what we would frequently call a “melting ice cube.”
Over the longer term, economies are working hard to wean themselves off of their fossil fuel addictions. Renewable energy is cleaner, more economically efficient, and safer for workers.
Demand for oil and gas is also slated to decline. The automotive industry, which has historically been one of the largest demand sources for oil, is moving towards electrification, which requires far less input energy. Solar panels on home roofs will replace fossil fuel plants as the primary power source for air conditioning units during the summer.
Similarly, companies that rely on fossil fuels will slowly find it more difficult to turn a profit as governments levy heavier and heavier carbon taxes.
As the short-term tailwinds and the long-term headwinds tug at the oil industry, investors may be better served doing aggregate analyses of energy company financials. This way, they can get a better sense of whether the outlook has truly improved.
Let’s use Uniform Accounting to investigate the top fifteen holdings of XLE to answer this exact question.
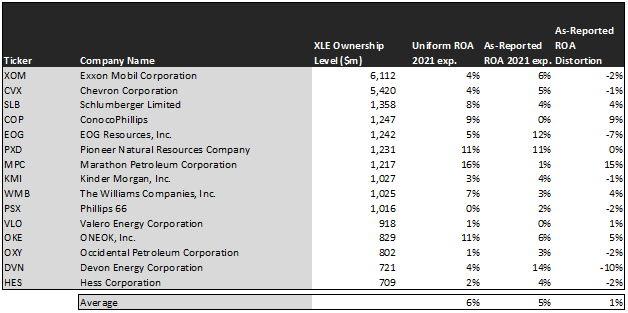
To capture the unique developments happening in the oil and gas space in 2021, this chart uses analyst-consensus 2021 data. This combines the actual results from the first two quarters, and expectations for the third and fourth quarters. Although analysts’ estimates aren’t perfect, they spend every day thinking about market trends, conditions, and management initiatives to make reasonable best-guesses for upcoming performance.
With an average Uniform ROA of 6%, these companies are experiencing some strength relative to recent years.
Looking back several years, Uniform ROA increased from around 1% levels in 2016 to 5% levels in 2019, before dropping back to 1% amid 2020 shutdowns, and recovering to 6% levels for this current year.
In each year, as-reported ROA was within 2 percentage points of Uniform ROA, signaling that investors aren’t getting misled by GAAP distortions in any particular direction (as we so frequently observe with more complex names, as GAAP has more places to mislead investors).
This shows that the tailwinds pushing oil and gas stocks higher are reflected in actual corporate profitability. They are real, and investors have every right to be excited by them.
But there is another crucial step to understanding if the sector is a good investment. Investors need to know if valuations are representative of reasonable outcomes, or if there is room on the table for stock values to appreciate.
To quantify the answer to this question, we can use our Embedded Expectations Analysis:

This chart shows four interesting data points:
- The Uniform ROA 2021 exp. represents the company’s expected 2021 ROA, which is a crucial benchmark for contextualizing expectations for the future.
- The analyst-expected Uniform ROA represents what ROA is forecast to be over the next two years. To get the ROA number, we take consensus Wall Street estimates and we convert them to the Uniform Accounting framework.
- The market-implied Uniform ROA is what the market thinks Uniform ROA is going to be in three years following the analyst expectations, or in 2025. Here, we show the sort of economic productivity a company needs to achieve to justify its current stock price.
- The Uniform P/E is our measure of how expensive a company is relative to its Uniform earnings. For reference, average Uniform P/E across the investing universe is roughly 24x.
The market is pricing these 15 companies to land at 7% Uniform ROA in 2025, just 1% higher than their current ROA.
Analysts, coincidentally, have the exact same opinion, expecting ROA’s to be around 7% in 2023.
The important takeaway is that the shorter-term tailwinds in the energy business are already priced in, which should come as no surprise given the attention that the oil and gas business gets.
This also shows that profitability probably won’t improve much past current levels. The best that investors can expect is a prolongment of favorable conditions, rather than another step-change improvement.
Past these projections and into the second half of the decade, we can reasonably expect the cyclicality of oil and gas to bring prices, and corporate profits, back down.
Moreover, ever-tightening regulations and rapid advancements in battery technology that will enable renewables to compete with fossil fuels at scale will put further long-term pressure on these companies.
Investors need to take a long hard look at the competing headwinds and tailwinds involved in the energy business. This is especially important considering these companies are already trading at a fairly expensive 37.5x multiple of Uniform Earnings.
Even amid historic one-time tailwinds caused by the pandemic, the story seems not to have changed. Legacy oil companies still face long-term existential threats, and short-term tailwinds have already been priced in.
Betting on a prolonged increase in the valuations of these companies would be a bet on prolonged market irrationality, as it would entail valuations to imply higher returns than can be reasonably expected.
That isn’t to say that the market cannot maintain irrational valuations for extended periods of time. The equity markets are dominated by exuberant valuations that are well beyond the realm of reason.
But our consistently market-beating Conviction Long List has never bet on prolonged irrationality. Overall, we aim to find companies that are clearly undervalued, and experiencing powerful tailwinds in the short term and the long term.
Click here to get access.
Read on to see a tearsheet of XLE’s largest holding.
SUMMARY and Exxon Mobil Corporation Tearsheet
As XLE’s largest individual stock holdings, we’re highlighting Exxon Mobil Corporation’s tearsheet today.
As the Uniform Accounting tearsheet for Exxon Mobil Corporation (XOM:USA) highlights, its Uniform P/E trades at 18.9x, which is below the global corporate average of 24.3x, but around its own historical average of 19.2x.
Low P/Es require low EPS growth to sustain them. In the case of Exxon Mobil, the company has recently shown a 559% Uniform EPS shrinkage.
Wall Street analysts provide stock and valuation recommendations that, in general, provide very poor guidance or insight. However, Wall Street analysts’ near-term earnings forecasts tend to have relevant information.
We take Wall Street forecasts for GAAP earnings and convert them to Uniform earnings forecasts. When we do this, Exxon Mobil’s Wall Street analyst-driven forecast is for EPS to shrink by 168% in 2021, followed by a 13% EPS growth in 2022.
Meanwhile, the company’s earning power is below the long-run corporate averages. However, cash flows and cash on hand consistently exceed total obligations—including debt maturities, capex maintenance, and dividends. Moreover, Exxon Mobil’s intrinsic credit risk is 30 bps above the risk free rate. Together, these signal low credit and dividend risks.
Lastly, Exxon Mobil’s Uniform earnings growth is below peer averages, but the company is trading in line with its average peer valuations.
Best regards,
Joel Litman & Rob Spivey
Chief Investment Strategist &
Director of Research
at Valens Research