
This chemicals firm proves the value of completely dominating your niche

Investors are blind to the true profitability of this chemical company. It services a tiny but essential niche, which has helped it generate strong earnings in the past.
These niche players often make the mistake of growing out of their niche instead of returning value to shareholders, which sometimes leads to a decline in earnings power.
Also below, the company’s Uniform Accounting Performance and Valuation Tearsheet.
Investor Essentials Daily:
Thursday Tearsheets
Powered by Valens Research
When we analyze microcap companies here at Valens, we have to pay attention to different metrics than a large firm.
One of our clients has a particularly long standing legacy in the microcap space. When analyzing microcaps, this client often asks us to watch for where the company puts its cash. Specifically, niche microcaps typically either return that cash to shareholders or invest it in new business lines.
The latter is a major red flag. Our client says it’s a sign to bail if a niche company starts expanding past its niche. It’s extremely difficult to recreate the profitability of a firm’s core business, unless management is building a new part of the business complementary to the existing core business.
Otherwise, these expansion projects tend to destroy value and bring the company’s returns back to earth.
This is just one example of why shareholders are attracted to companies that solely focus on their core competencies.
Great businesses know that sticking to their niche can sometimes be the best bet. This is a sign the business is already highly profitable.
This idea holds true for firms that operate in niche markets like chemicals. One example of a company that fits this mold is Innospec (IOSP).
Innospec’s most profitable business is making the additives that go into raw fuel. These additives improve overall fuel efficiency, safety, and enable fuel to last longer, along with many other benefits.
As mentioned, this firm operates in a unique niche even within the specialty chemicals industry. As a result, investors looking only at the GAAP metrics assume Innospec is unable to beat market average returns.
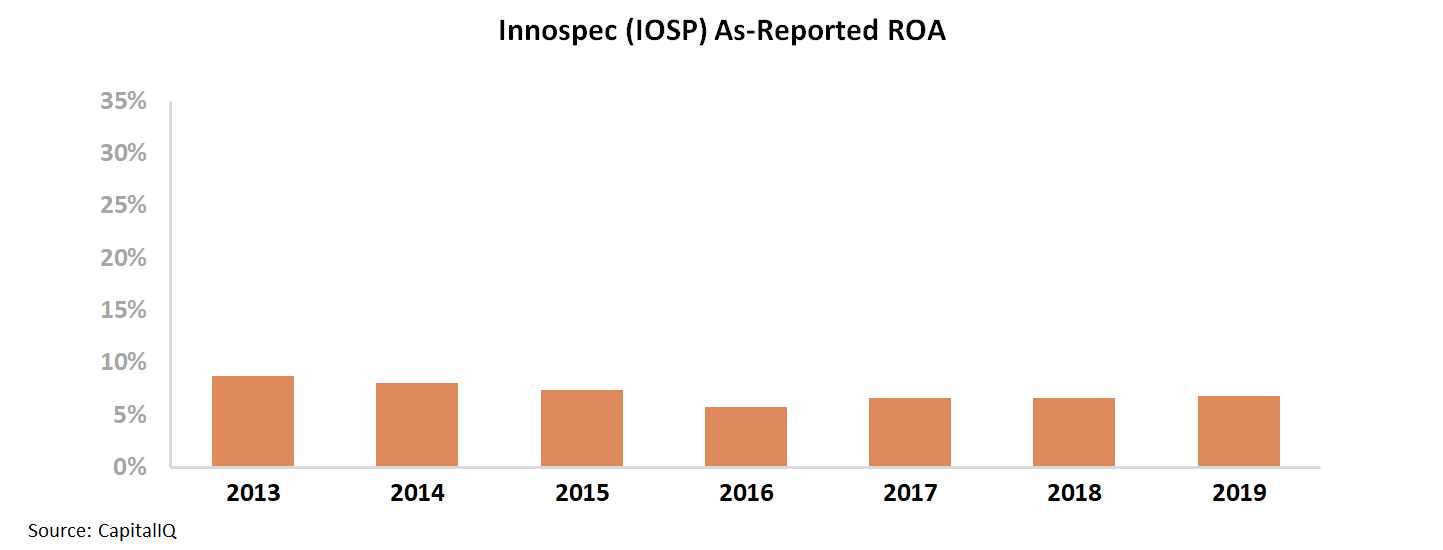
On an as-reported basis, ROA faded from 9% levels in 2013 to 6% levels in 2016. Since 2016, ROA has slightly expanded from 6% to 7%.
By looking at as-reported metrics, investors might conclude that this specialty chemicals stock generates returns near the corporate average. By operating within such a niche segment in the industry, Innospec is at a disadvantage compared to other manufacturers.
In reality, this view is fueled by distortions in GAAP. Innospec has higher than average returns for a chemicals stock. This achievement can be attributed to the firm’s strategy and robust operations.
When looking through a Uniform Accounting lens, it becomes clear that the firm’s business model is better than it seems.
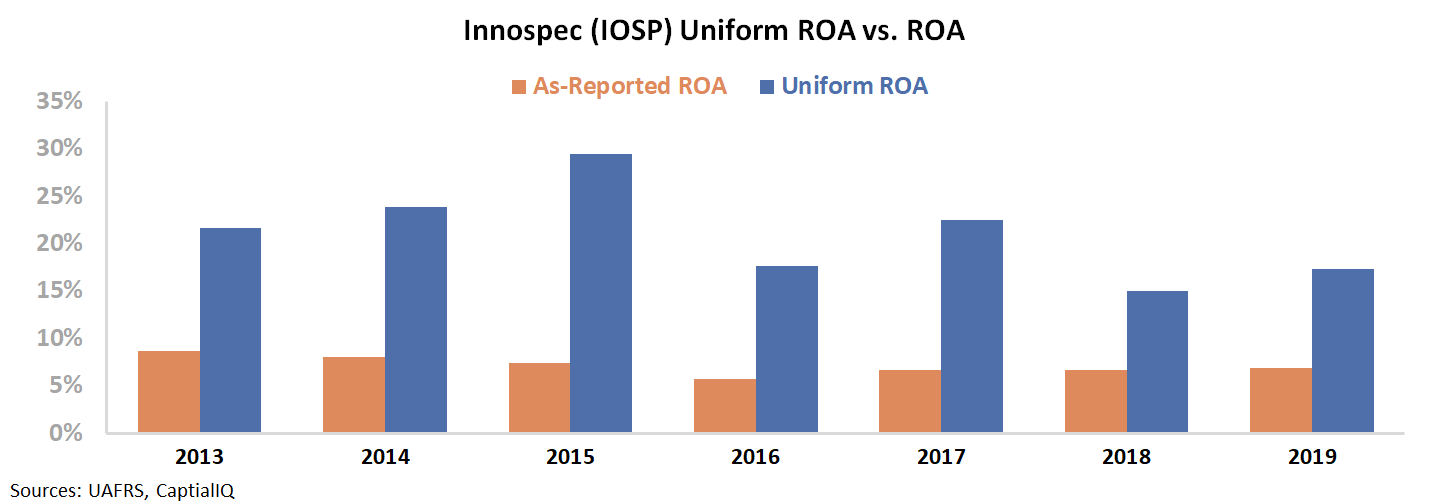
On a Uniform Accounting basis, Innospec’s ROA slightly declined from 22% levels in 2013 to 18% levels in 2016. Since 2016, ROA has maintained 15% to 23% levels. Overall ROA has consistently been above corporate average levels of 12%.
As you can see, Innospec’s Uniform ROA levels are trending well above as-reported metrics, which portrays how easily as-reported metrics can misrepresent reality.
Over the past few years, the company has been investing heavily in the business. This is why Uniform ROA has been slowly declining the past five years.
To understand if the market is expecting this to continue, we can turn to our Embedded Expectations Framework.
Most investors determine stock valuations using a discounted cash flow (DCF) model. Investors build a DCF model using assumptions about the future, which then produces the “intrinsic value” of the stock.
However, here at Valens, we know models with garbage-in assumptions only come out as garbage. This is why we turn the DCF model on its head in the below chart. Here, we use the current stock price to solve for what returns the market expects the firm to make.
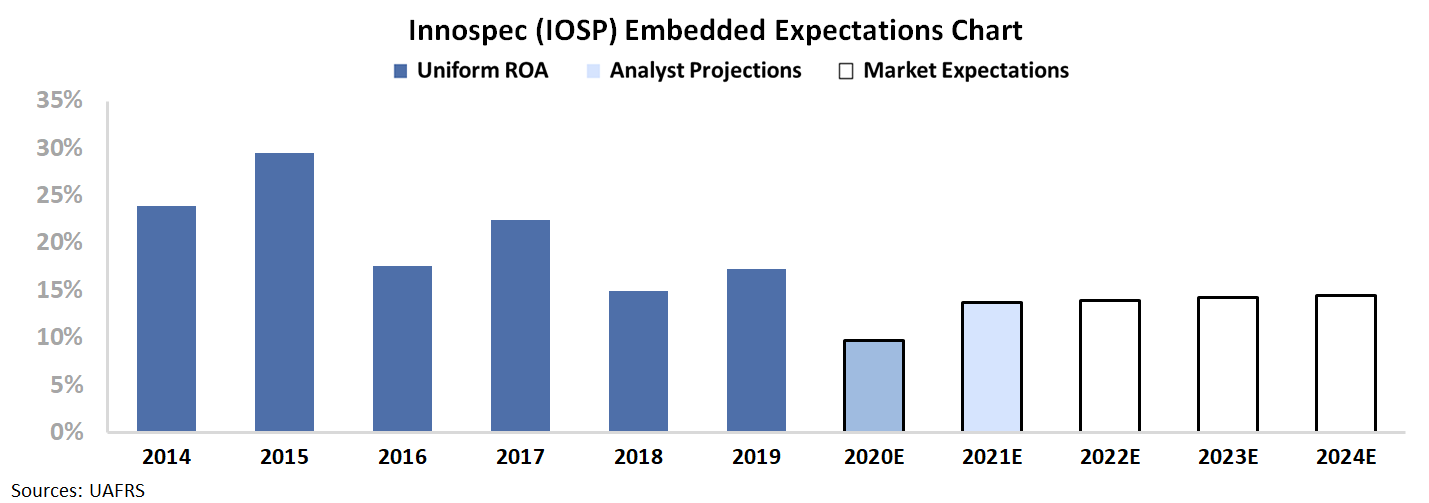
The dark blue bars represent the historical corporate performance levels, in terms of ROA. The light blue bars are Wall Street analysts’ expectations for the next two years. Finally, the white bars are the market’s expectations for how ROA will shift in the next five years.
The Embedded Expectations Chart shows the market is expecting this investment into the business to continue, suppressing returns through the next five years. The market is only pricing ROA to be 15% through 2024, well below Innospec’s historical profitability.
As management is continuing to invest into the core business, this is a stock to watch for a potential roll-over.
When management lets revenue flow to the bottom line, there could be a potential buying opportunity, as investors underestimate the resiliency of Innospec’s core business. With Uniform Accounting, investors would never spot the inherent value in Innospec’s market niche.
SUMMARY and Innospec, Inc. Tearsheet
As the Uniform Accounting tearsheet for Innospec, Inc. (IOSP:USA) highlights, the Uniform P/E trades at 23.5x, which is around the global corporate average of 25.2x, but above its own historical average of 21.4x.
Average P/Es require average EPS growth to sustain them. That said, in the case of Innospec, the company has recently shown a 30% Uniform EPS growth.
Wall Street analysts provide stock and valuation recommendations that in general provide very poor guidance or insight. However, Wall Street analysts’ near-term earnings forecasts tend to have relevant information.
We take Wall Street forecasts for GAAP earnings and convert them to Uniform earnings forecasts. When we do this, Innospec’s Wall Street analyst-driven forecast is a 53% EPS decline in 2020 and 55% EPS growth in 2021.
Based on the current stock market valuations, we can use earnings growth valuation metrics to back into the required growth rate to justify Innospec’s $95 stock price. These are often referred to as market embedded expectations.
The company can have Uniform earnings shrink by 1% per year over the next three years and still justify current stock prices. What Wall Street analysts expect for Innospec’s earnings growth is below what the current stock market valuation requires in 2020, but above that requirement in 2021.
Furthermore, the company’s earning power is 3x the long-run corporate average. Also, cash flows and cash on hand are almost 3x its total obligations—including debt maturities, capex maintenance, and dividends. All in all, this signals a low credit risk.
To conclude, Innospec’s Uniform earnings growth is below its peer averages but the company is trading in line with its average peer valuations.
Best regards,
Joel Litman & Rob Spivey
Chief Investment Strategist &
Director of Research
at Valens Research


