
Is value investing a lost art? Not if you study the ‘three-legged stool’ approach

Value investing has not been in vogue for some time, and this fund has benefited by deprioritizing value in its investment process.
But that doesn’t mean its team has completely forsaken all the valuable insights Warren Buffett’s investing philosophy can offer. The firm has just stated it wants to selectively apply some of Warren’s rules, while strongly avoiding others.
Using as-reported numbers, it appears the firm is ignoring all Buffett’s rules. In reality, UAFRS-based financial metrics help make sense of the stocks the fund is buying, and how they line up perfectly.
In addition to examining the portfolio, we’re including a deeper look into the fund’s largest current holding, providing you with the current Uniform Accounting Performance and Valuation Tearsheet for that company.
Investor Essentials Daily:
Friday Uniform Portfolio Analytics
Powered by Valens Research
When we highlighted Akre Capital’s portfolio roughly one year ago, it was a top performer.
Specifically, the fund posted staggering returns in the three years leading up to 2019.
Part of the reason this was the case was because of the fund’s focus on their own strategy, that was known as the “3 legged stool”.
It was similar to Buffett’s philosophy, but it was not exactly the same.
Of course over the timespan of 2020 the fund’s holdings changed, so we thought it would be worthwhile to revisit our old report with an updated analysis of the fund’s holdings.
We can unpackage if this was related to the fund’s ability to stay true to its 3 legged stool using Uniform Accounting, or if it was because they deviated from that strategy over time.
Warren Buffett is widely respected as not just the greatest value investor of modern times, but the greatest investor.
Berkshire Hathaway’s returns, both how strong they are and for how long, certainly warrant that title.
Some have been wondering if his lack of action during the pandemic-driven panic in the market is a sign he is starting to “lose his fastball.”
Those arm-chair quarterbacks wonder if he’s become less open to the opportunities in the market, and how the market works today.
There are some parts of Buffett’s philosophy that these investors think are solid core parts of the right kind of investment approach.
His focus on buying high-return businesses with strong economic moats means high visibility for cash flows. Similarly, his focus on quality management teams can give investors confidence that they aren’t investing in a melting ice cube where management mis-steps could disrupt a cash cow.
But these investors appear to question his focus on value, or as Ben Graham and Seth Klarman would say, his focus on “margin of safety,” when making investments.
Quantitative investors have been highlighting how value is “broken” right now too. Quant research greats like Cliff Asness aren’t saying value is dead, but that it is not a factor the market is paying attention to right now.
In an environment like this, it is no wonder a company that de-prioritizes value would have been a big winner the last few years.
Akre Capital Management is a top 3 hedge fund in terms of 3 year performance according to TipRanks.
The team has built this performance on a strong belief in Buffett’s focus on quality companies and management teams. But the “three-legged stool” of the key characteristics the team focuses on differs from Buffett on the third.
Akre cares about finding high-return firms with economic moats, strong management teams and culture they can trust to continue to create value, and the ability for these companies to compound growth over long periods of time.
Buffett also pays attention to companies with growth opportunities, but it is a distant focus relative to finding value. For Akre, growth is far more important than the value you’ll be paying for that growth.
Looking at Akre’s portfolio though, it’s not obvious that the fund invests in either high quality companies or growth opportunities using as-reported metrics.
We’ve conducted a portfolio audit of Akre’s top holdings, based on its most recent 13-F.
We’re showing a summarized and abbreviated analysis of how we work with institutional investors to analyze their portfolios.
Unsurprisingly, while as-reported metrics of Akre’s investments make it look like Akre doesn’t care at all about quality, in reality these investments appear to be higher quality names, once Uniform Accounting metrics are reviewed.
It’s clear that when Akre is making its investment decisions, the team is making decisions based on the real data.
See for yourself below.
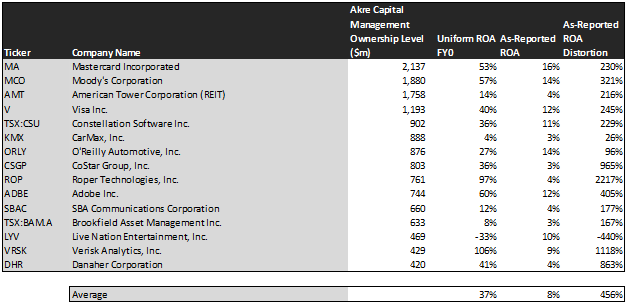
Using as-reported accounting, investors would think Akre was buying anything other than the “forever” businesses like they talk about.
On an as-reported basis, many of these companies are poor performers with returns below 10%, and the average as-reported return on assets (ROA) is right at 8%.
In reality, the average company in the portfolio displays an impressive average Uniform ROA at 37%.
Once we make Uniform Accounting (UAFRS) adjustments to accurately calculate earning power, we can see these are the kind of high return compounders that Akre would be expected to invest in.
Once the distortions from as-reported accounting are removed, we can realize that Verisk Analytics (VRSK) doesn’t have a 9% ROA, it is actually at 106%.
Similarly, Roper Technologies’ (ROP) ROA is really 97%, not 4%. While as-reported metrics are portraying the company as a barely profitable business, Uniform Accounting shows the company’s real robust operations.
Adobe (ADBE) is another great example of as-reported metrics mis-representing the company’s profitability.
Adobe doesn’t have a 12% ROA, it is actually at 60%. Akre appears to understand that market expectations for the company, thinking it’s a weak business, is completely incorrect.
The list goes on from there, for names ranging from Moody’s (MCO) and Visa (V), to SBA Communications (SBAC), Constellation Software (TSX:CSU), and Live Nation (LYV).
If Akre were focused on as-reported metrics, it would never pick most of these companies because they look like anything but companies with strong economic moats, sound operations, and significant growth opportunities.
But it appears that Akre is making a broader bet than just on high-quality firms. It has put a stake in the ground, saying that quality and growth matter, but that valuation doesn’t.
It wouldn’t necessarily be apparent when looking at the as-reported metrics, but Uniform Accounting metrics paint a complete picture of the fund’s investment philosophy.
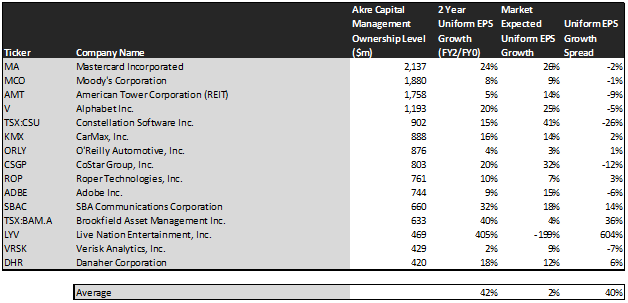
This chart shows three interesting data points:
- – The first datapoint is what Uniform earnings growth is forecast to be over the next two years, when we take consensus Wall Street estimates and we convert them to the Uniform Accounting framework. This represents the Uniform earnings growth the company is likely to have, the next two years.
- – The second datapoint is what the market thinks Uniform earnings growth is going to be for the next two years. Here, we are showing how much the company needs to grow Uniform earnings in the next 2 years to justify the current stock price of the company. If you’ve been reading our daily and our reports for a while, you’ll be familiar with the term embedded expectations. This is the market’s embedded expectations for Uniform earnings growth.
- – The final datapoint is the spread between how much the company’s Uniform earnings could grow if the Uniform Accounting adjusted earnings estimates are right, and what the market expects Uniform earnings growth to be.
The average company in the US is forecast to have 5% annual Uniform Accounting earnings growth over the next 2 years. Akre’s holdings are forecast by analysts to grow more than that, growing at 42% a year the next 2 years, on average.
Akre appears to be betting the analysts know more than the market, and is expecting stronger fundamental tailwinds going forward.
On average, the market is pricing these companies to grow earnings by only 2% a year. Analysts are pricing these companies for growth to be 40% higher than the market is forecasting. For Akre to see these stocks appreciate, they just need to beat market expectations.
This is exactly in line with Akre’s three part process of focusing on high quality companies with strong management teams and growth compounding opportunities.
One example of a company in the Akre portfolio that has growth potential that the market is mispricing is Brookfield Asset Management (TSX:BAM.A). Brookfield’s analyst forecasts have 40% Uniform earnings growth built in, but the market is pricing the company to have earnings growth of only 4% each year for the next two years.
Another company with similar dislocations is SBA Communications (SBAC). This might look like a company Akre is misunderstanding initially, with low market expectations.
Market expectations call for 18% growth in earnings. However, the company is actually forecast for Uniform EPS to grow by 32% a year. SBAC simply has to overcome these dour expectations to see upside.
Overall, it is clear Akre is all in on quality growth, and throwing valuation cares to the wind. It wouldn’t be clear under GAAP, but unsurprisingly Uniform Accounting sees the same signals that Akre says it is investing in.
SUMMARY and Mastercard Incorporated Tearsheet
As Akre Capital Management LLC’s largest individual stock holding, we’re highlighting Mastercard’s tearsheet today.
As our Uniform Accounting tearsheet for Mastercard Incorporated (MA:USA) highlights, Mastercard’s Uniform P/E trades at 40.4x, which is above the global corporate valuation of 25.2x and its own historical valuation of 36.7x.
High P/Es require high EPS growth to sustain them. In the case of Mastercard, the company has recently shown a 16% Uniform EPS decline.
Wall Street analysts provide stock and valuation recommendations that in general provide very poor guidance or insight. However, Wall Street analysts’ near-term earnings forecasts tend to have relevant information.
We take Wall Street forecasts for GAAP earnings and convert them to Uniform earnings forecasts. When we do this, Mastercard’s Wall Street analyst-driven forecasts are for a 22% and 27% EPS growth in 2021 and 2022, respectively.
Based on current stock market valuations, we can back into the required earnings growth rate that would justify Mastercard’s $353.85 stock price. These are often referred to as market embedded expectations.
The company is currently being valued as if Uniform earnings were to grow by 24% per year over the next three years. What Wall Street analysts expect for Mastercard’s earnings growth is below what the current stock market valuation requires in 2021, but above that requirement in 2022.
Furthermore, the company’s earning power is 30x the corporate average. Also, cash flows and cash on hand are 6x its total obligations—including debt maturities, capex maintenance, and dividends. Together, this signals a low credit and dividend risk.
To conclude, Mastercard’s Uniform earnings growth is above its peer averages, while their valuations are traded well above its average peers.
Best regards,
Joel Litman & Rob Spivey
Chief Investment Strategist &
Director of Research
at Valens Research


