
Julian Robertson’s failures led this thematic Tiger Cub to 80% returns this year, and Uniform Accounting reveals how

Thematic investing involves creating a portfolio of companies around particular market trends. If the theme outperforms, the best names within the theme will do well. By marking the universe of potential stocks to buy smaller, investors can rigorously evaluate companies within emerging themes.
Today, we highlight one of the most successful thematic funds. Its founder got his start at the famous Tiger Management and seeks to apply his learnings today.
In addition to examining the portfolio, we are including a deeper look into the fund’s largest current holding, providing you with the current Uniform Accounting Performance and Valuation Tearsheet for that company.
Investor Essentials Daily:
Friday Uniform Portfolio Analytics
Powered by Valens Research
“Tiger Cubs” are the nicknames given to hedge funds run by managers who got their start at the famous Tiger Management.
Tiger Management was run by Julian Robertson and was at one point the second-largest hedge fund in the world. We wrote about what led to the fund’s downfall in October last year.
Tiger Management turned $8 million in capital in 1980 to over $20 billion at its peak in 1998. However, the fund collapsed due to a series of poorly timed bets in the late 1990s before the internet bubble.
One of the big strategies to come out of this fund was the idea of thematic investing. The goal was to identify driving market trends, or “themes,” and find the best names within them.
These include the shift to cloud computing, the adoption of streaming services, or the Software as a Service (SaaS) model. All of these themes have produced an array of winners.
As any great investor will say, there are two critical questions when investing: What to buy and when to buy it. Tiger Cubs focus on thematic investing because it can help answer these questions.
The Tiger Cubs share information with each other and will even enter these themes together. The timing is still relevant, but correctly identifying themes can make the process of selecting individual stocks easier.
Additionally, by sharing information, the Tiger Cubs have access to a wide network of brilliant investors to share the burden of research.
One such Tiger Cub to have seen success using this strategy is David Goel’s Matrix Capital Management. Goel has focused his investments on the technology, media, and telecommunications sectors.
Goel was early to the cloud computing boom, receiving attention in 2012 for his early support for names in the space.
Matrix focuses its investment on a 10-year time horizon. This allows themes to fully play out and for innovation to occur.
The fund also leverages market analytics to time its investments. These include oscillators, DeMark Indicators, and other tools to identify companies in optimal trading patterns. This helps Matrix identify some of the best names within a particular theme.
The fund currently manages over $6 billion in capital and has been one of the most successful Tiger Cubs to date.
However, using as-reported metrics, it appears Matrix is buying into low return companies with declining earnings.
Some investors may assume buying into emerging themes means sacrificing current profitability.
In truth, these securities are already strong performers once Uniform Accounting metrics are universally applied across the portfolio.
See for yourself below.
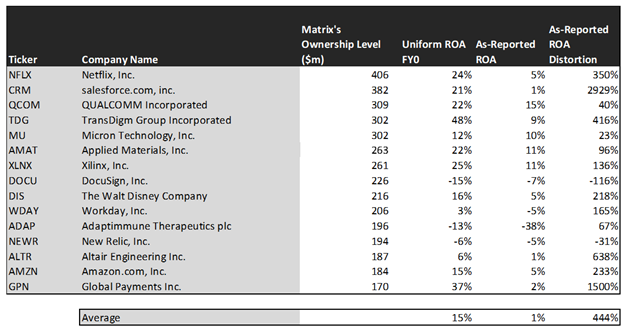
On an as-reported basis, many of these companies are poor performers with returns at 10% or below, with the average as-reported return on assets (ROA) right around 1%.
In reality, the average company in the index displays an impressive average Uniform ROA of 15%.
Once we make Uniform Accounting (UAFRS) adjustments to accurately calculate earnings power, we can see the underlying strength of the portfolio.
Once the distortions from as-reported accounting are removed, we can see Global Payments (GPN) does not have a return of 2%, but a sizable ROA of 37%.
Similarly, TransDigm’s (TDG) ROA is really 48%, not 9%. While as-reported metrics are portraying the company as a slightly above cost-of-capital business, Uniform Accounting shows the company’s profitability.
The list goes on from there, for names ranging from Netflix (NFLX) and salesforce.com (CRM), to Xilinx (XLNX).
If investors were to only look at as-reported metrics, they would assume Matrix is investing in low-quality businesses.
Now, let us see how these firms’ returns can strengthen over time through EPS growth.

This chart shows three interesting data points:
- The 2-year Uniform EPS growth represents what Uniform earnings growth is forecast to be over the next two years. The EPS number used is the value of when we take consensus Wall Street estimates and we convert them to the Uniform Accounting framework.
- The market expected Uniform EPS growth is what the market thinks Uniform earnings growth is going to be for the next two years. Here, we show by how much the company needs to grow Uniform earnings in the next 2 years to justify the current stock price of the company. If you’ve been reading our daily analyses and reports for a while, you’ll be familiar with the term embedded expectations. This is the market’s embedded expectations for Uniform earnings growth.
- The Uniform EPS growth spread is the spread between how much the company’s Uniform earnings could grow if the Uniform earnings estimates are right, and what the market expects Uniform earnings growth to be.
The average company in the U.S. is forecast to have 5% annual Uniform Accounting earnings growth over the next 2 years. In comparison, these top stocks are forecasted by analysts for 4% Uniform earnings growth.
On average, the market is pricing these companies to grow earnings by 25% a year. This highlights how Matrix’s focus on thematic investing leads it to industries with high growth expectations.
One example of a company with high growth potential is QUALCOMM (QCOM). While the market expects QUALCOMM to grow by 17% over the next two years, analysts forecast the firm to see 70% growth over the same period.
Another example is Applied Materials (AMAT). The company is cheap, as it is priced for Uniform earnings to shrink by 3%, but the company is forecast to in fact grow its EPS by 19% in the next two years.
That being said, there are many companies forecast to have earnings growth less than market expectations. For these companies, like salesforce.com, Altair Engineering (ALTR), and Global Payments, the market has growth expectations in excess of analysts’ predictions.
In conclusion, Matrix Capital Management has been successful in identifying rising themes and choosing the best names within those themes.
The largest companies in this fund possess high returns, but growth projections are lower than market expectations once we remove the as-reported distortions.
It becomes clear that investing in emerging themes does not mean sacrificing on high-quality businesses.
SUMMARY and Netflix, Inc. Tearsheet
As Matrix Capital Management’s largest individual stock holding, we’re highlighting Netflix, Inc.’s (NFLX:USA) tearsheet today.
As the Uniform Accounting tearsheet for Netflix highlights, their Uniform P/E trades at 47.3x, which is well above global average valuation levels and above its historical average valuations.
High P/Es require high EPS growth to sustain them. In the case of Netflix, the company has recently shown a 45% Uniform EPS growth.
Wall Street analysts provide stock and valuation recommendations that in general provide very poor guidance or insight. However, Wall Street analysts’ near-term earnings forecasts tend to have relevant information.
We take Wall Street forecasts for GAAP earnings and convert them to Uniform earnings forecasts. When we do this, Netflix’s Wall Street analyst-driven forecast is a Uniform EPS growth of 40% and 35% in 2020 and 2021, respectively.
Based on current stock market valuations, we can use earnings growth valuation metrics to back into the required growth rate to justify Netflix’s $515 stock price. These are often referred to as market embedded expectations.
The company would need to grow its Uniform earnings by 35% each year over the next three years to justify their current valuation. What Wall Street analysts expect for Netflix’s earnings growth is above what the current stock market valuation requires in 2020 and just meets that requirement in 2021.
Furthermore, the company’s earning power is 4x the corporate average. Also, cash flows are also 4x higher than total obligations—including debt maturities, capex maintenance, and dividends. Together, this signals low credit risk.
To conclude, Netflix’s Uniform earnings growth is around peer averages in 2020, but is trading well above average peer valuations.
Best regards,
Joel Litman & Rob Spivey
Chief Investment Strategist &
Director of Research
at Valens Research