
This Company is a Great Example of Why Recessionary Risk is Fading

Those of you who have read our Market Phase Cycle™ report know that a core focus of our macro work is on understanding credit cycles.
Over the last 150 years of recorded financial history, it is very difficult if not impossible to find a bear market without first seeing a seizure in the credit markets that precede it.
That goes for S&L Crisis, the Asia Financial Crisis, the Great Recession, the market panic of 1907, the Great Depression in 1929, and the 1970s if you still needed more examples.
All the market collapses that people care about, severe bear markets, have been preceded by a major breakdown in credit availability and financing.
The thing that causes credit seizures is borrowers needing to refinance debts at the very moment they cannot. To understand when that can happen in the corporate market, we use Uniform Accounting analytics to create an aggregate picture of debt maturity headwalls, corporate cash flows, and other obligations. This can gives us a window into when debt is coming due, and when there could be a credit crunch.
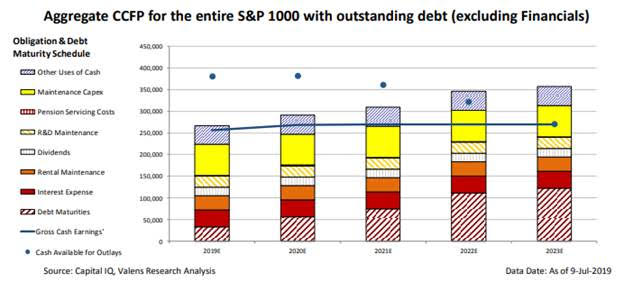
The above chart highlights the aggregated “Credit Cash Flow Prime” chart for the S&P 1000, the S&P 1500 minus the S&P 500.
We focus on the S&P 1000 because the S&P 500 companies are so large and have such healthy income statements and balance sheets, that they wash out any insight around credit risk for the companies that are the real potential catalyst for a credit crisis.
The chart’s vertical bars represent all financial obligations US companies have after Uniform Accounting adjustments.
The blue line represents the aggregate corporate cash flows used to handle those obligations. The blue circles are aggregate cash on hand (added to the cash flow each year). Companies begin getting in trouble when their cash and cash flows no longer exceed the stack.
In aggregate, US corporations can nearly service all of their obligations including share buybacks with cash flow alone, and their cash allows a fair amount of buffer should any factors impact their cash flows until 2022.
When we look at this chart, 2021 is the year that concerns us, because there is so little buffer between cash flow and non-share buyback obligations. If companies haven’t continued to steward their cash, and don’t refinance their 2021 debt maturities before 2021, there may be issues then.
This is the reason why in January of this year, we wrote a Market Phase Cycle™ report titled “A RECESSION IS COMING…in 1.5-2 years if trends do not change before then.” If companies can’t refinance their 2021 debt maturities when they need to, the economy could run into trouble, as soon as late 2020 or early 2021.
But a powerful thing happened between mid-January and today. The cost to borrow for US corporates has fallen by roughly 150-200bps for both high yield and investment grade credits. Because of that, many companies that had debt maturities in 2019-2021 have refinanced those debt maturities out. The debt maturity headwall is no longer as severe as it used to be.
That means we’re pushing off our concern for a recession and a severe bear market for another few quarters, until late 2021 at the earliest.
KB Homes (KBH) is a great example of this phenomenon at work. KB Homes used to have $350 million of debt coming due in 2020, along with roughly $500 million coming due in 2021. It was the exact kind of company that was sounding alarm bells for our credit analysis.
But in October, KB Homes announced their issuance of $300 million in 2029 notes. They plan to use this and $50 million in cash to refinance the 2020 bonds, pushing their debt maturity headwall out. This is the type of issue that wouldn’t have happened earlier this year, or in 2018, when interest rates were higher.

Market concerns about the economy overall, and KB Homes credit headwalls in particular, caused KB Homes to drop over 50% from their early 2018 highs to their November 2018 lows. The stock has subsequently recovered, in particularly recently, as credit risks have been alleviated.
This may make investors think that KBH’s credit story is played out, but because of how pessimistic markers were previously, expectations are still relatively low for KB Homes. And with KB Homes management growing confident about growth, their margin outlook, and about their backlog, there may be potential for equity upside.
Market expectations are for Uniform ROA compression, but management is confident about growth, margins, and their backlog
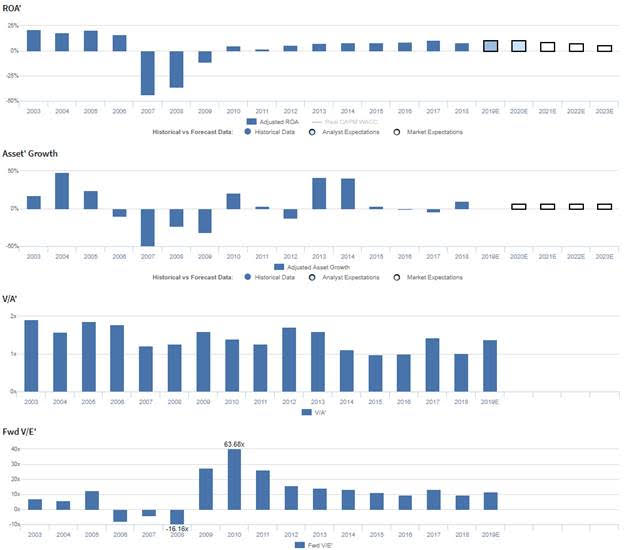
KBH currently trades well below corporate averages relative to UAFRS-based (Uniform) Earnings, with an 11.7x Uniform P/E. At these valuations, the market is pricing in expectations for Uniform ROA to fade from 8% in 2018 to 6% by 2023, accompanied by 6% Uniform Asset growth.
However, analysts have bullish expectations, projecting Uniform ROA to expand to 11% by 2020, accompanied by immaterial Uniform Asset growth.
KBH had robust profitability prior to 2007, with Uniform ROA ranging at 16-22% levels. However, as the housing market deteriorated in 2007-2009, KBH struggled to achieve positive profitability, with Uniform ROA ranging from -44% to -11%, before inflecting to 5% in 2010 and 2012. Thereafter, Uniform ROA expanded to 11% through 2017, before retracting back to 8% in 2018. Meanwhile, before the collapse of the housing market, KBH had robust Uniform Asset growth, ranging from 18% to 48%, but from 2006-2010, as the market took a turn for the worse, KBH shrunk its asset base aggressively, ranging from -10% to -50% annually. Since then, Uniform Asset growth has generally been more consistent, positive in six of the past nine years, while ranging from -12% to 42%.
Performance Drivers – Sales, Margins, and Turns
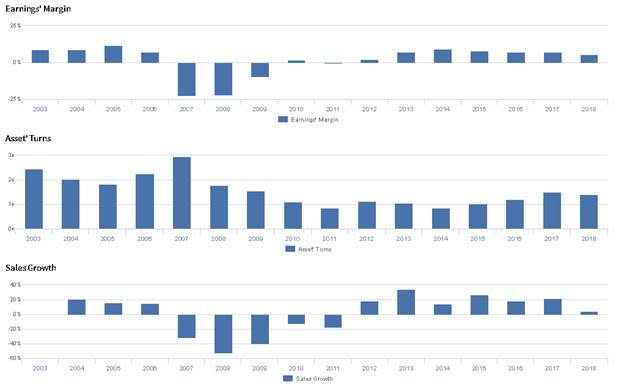
Trends in Uniform ROA have been driven by trends in both Uniform Earnings Margin and Uniform Asset Turns. From 2003-2006, Uniform Margins maintained 7%-12% levels, before falling to -20% in 2008, and recovering to 5% in 2012. Then, Uniform Margins steadily improved to 9% in 2014, before falling to 6% in 2018. Meanwhile, after declining from 2.5x in 2003 to 1.8x in 2005, Uniform Turns rebounded to 3.0x in 2007, before steadily declining to a low of 0.9x in 2011. Thereafter, Uniform Turns expanded to 1.1x in 2012, compressed to 0.8x in 2014, and rose to 1.4x-1.5x levels in 2017-2018. At current valuations, markets are pricing in expectations for further compression in Uniform Margins and a reversal of the recent expansion in Uniform Turns.
Earnings Call Forensics
Valens’ qualitative analysis of the firm’s Q3 2019 highlights that management generated an excitement marker when discussing how they can grow organically in the cities they are present in. Furthermore, they are confident they have a solid backlog position going into 2020 and that their land held for future development will act as a margin tailwind. Moreover, they are confident in their ability to meet their revised margin guidance. However, they may lack confidence in their ability to drive margin growth through shifting to higher-margin core communities, and they may lack confidence in their ability to sustain 30% year-over-year growth on the West Coast. Furthermore, they may be concerned about further increases in SG&A expenses and about their ability to drive down community construction expenses.
UAFRS VS As-Reported
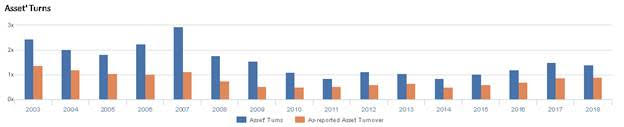
Uniform Accounting metrics also highlight a significantly different fundamental picture for KBH than as-reported metrics reflect. As-reported metrics can lead investors to view a company to be dramatically stronger or weaker than real operating fundamentals highlight. Understanding where these distortions occur can help explain why market expectations for the company may be divergent.
As-reported metrics significantly understate KBH’s asset efficiency, one of the main drivers of profitability. For example, as-reported asset turnover for KBH was 0.9x in 2018, much lower than Uniform Asset Turns of 1.4x, making KBH appear to be a weaker business than real economic metrics highlight. Moreover, as-reported asset turnover has consistently understated Uniform Asset Turns in each year since 2003, distorting the market’s perception of the firm’s historical asset efficiency trends.
Today’s Tearsheet
Today’s tearsheet is for Adobe. Adobe trades at a significant premium to market average valuations. The company has recently had Uniform EPS growth around 40%. EPS growth is forecast to moderate but remain strong. At current valuations, the market is similarly pricing in the company having health double digit earnings growth going forward.
The company’s earnings growth for 2019 is in line with peer average levels, but the company is trading at slightly below peer average valuations. The company has robust returns, with no cash flow risks.
Regards,
Joel Litman
Chief Investment Strategist