
This value stock is really a value trap, and Uniform Accounting shows why buying the company is an industry call, not a savvy value investor move

Companies with low valuations and high returns can look like an attractive value investment, but looks can often be deceiving.
This company is just one of many examples of a value trap; a firm that looks like a potentially undervalued security, but which is actually part of a larger industry play. An industry that is often justifiably cheap.
Also below, Uniform Accounting Embedded Expectations Analysis and the Uniform Accounting Performance and Valuation Tearsheet for the company.
Investor Essentials Daily:
Tuesday Tearsheets
Powered by Valens Research
Screening for ideas can sometimes feel like a hopeless task. It can seem like you are looking at the same company over and over again.
For instance, when screening for growth companies, 10 different Software as a Service (SaaS) companies may appear, each claiming to be the “next big thing,” despite almost identical business models.
Or in a valuation-based short screen (which by the way could be disastrous without a viable catalyst), a plethora of REITs and utilities may show. Low yields are causing these companies to look extremely expensive.
Currently, in deep value screens, one industry keeps on popping up: the auto and auto supplier industry. Many of these firms are trading at a sub-10x Uniform and as-reported P/E.
When looking at a Uniform ROA to Uniform V/A scatter (a scatter of these two metrics acts as a “smart P/E”), this valuation discrepancy becomes even more apparent.
Uniform ROA, also known as the profitability, and sometimes “quality” of a company, has a strong linear relationship with Uniform V/A, or valuation.
To be more specific, Uniform ROA is generally around 5x Uniform V/A. A company with a 5% Uniform ROA should have a 1x Uniform V/A. A company with a 10% Uniform ROA should equate to a 2x Uniform V/A. And so on and so forth.
This baseline relationship is represented in the graph below using the red line. Companies that fall above this scatter line can be viewed as potentially overvalued, and ones that fall below are thus potentially undervalued.
We’ve put the auto sector on the scatter here just for convenience.

Now an astute reader should recognize two noticeable issues with the Uniform ROA to Uniform V/A scatter of the auto and auto supplier industry listed.
First, a bunch of companies are clustered to the left of the red line and seem to have no discernible pattern. These are firms generating below cost-of-capital returns. As such, the ROA to V/A relationship does not hold. These firms trade on different factors, such as the recovery value of assets and default risk.
Second, almost all of the companies in these industries fall below the anticipated trend line. In this context, it appears the entire industry group trades cheap relative to the broader market.
This has major implications if you’re screening for value, and a company such as Lear Corporation (LEA), an American auto supplier focused on seating and electrical systems, pops up. It may mean that the firm is a value trap. Instead of making a call on a company, you may actually be making a call on an entire industry, and in this case, one that has legitimate concerns.
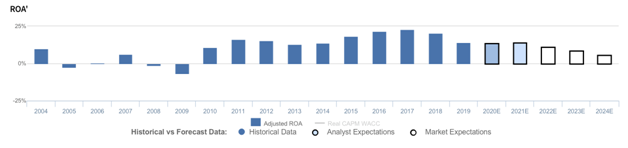
With a Uniform P/E of 10x, Lear looks like a cheap company, and with market expectations for Uniform ROA to drop from 14% to post-recession lows of 7%, all the firm needs to do is maintain profitability in order to justify significant upside.
However, the auto industry, as a whole, faces major headwinds that could signal a cyclical downward trend. And Lear is by no means immune.
In fact, Lear’s management demonstrated serious concerns about macro and operational factors in their latest earnings call.
Specifically, management may be concerned about further profitability impacts from the GM strike, and they may lack confidence in their ability to improve profitability in China.
Furthermore, they may lack confidence in their ability to drive efficiency through consolidating manufacturing plants, and realize cost savings from integrating their wire harness business.
Management’s concerns, coupled with legitimate macro industry concerns, suggest that low valuations and pessimistic management concerns appear to be warranted.
Lear Corporation Embedded Expectations Analysis – Market expectations are for Uniform ROA to reach 10-year lows, and management may be concerned about the GM strike, efficiency, and costs

LEA currently trades well below corporate averages relative to Uniform earnings, with a 9.5x Uniform P/E (Fwd V/E′).
At these levels, the market is pricing in expectations for Uniform ROA to contract from 14% in 2019 to 6% in 2024, accompanied by 4% Uniform asset growth going forward.
Analysts have less bearish expectations, projecting Uniform ROA to maintain 14% levels through 2021, accompanied by 5% Uniform asset shrinkage.
Prior to 2010, LEA had seen overall declines in profitability, with Uniform ROA falling from 10% in 2004 to a low of -7% in 2009.
However, in 2010, Uniform ROA rebounded to 11%, before stabilizing at 13%-16% levels through 2014, and eventually expanding to 23% in 2017, before falling to 14% in 2018.
Meanwhile, Uniform asset growth has been volatile, positive in just eight of the past 16 years, and ranging from -19% to 20%.
Performance Drivers – Sales, Margins, and Turns
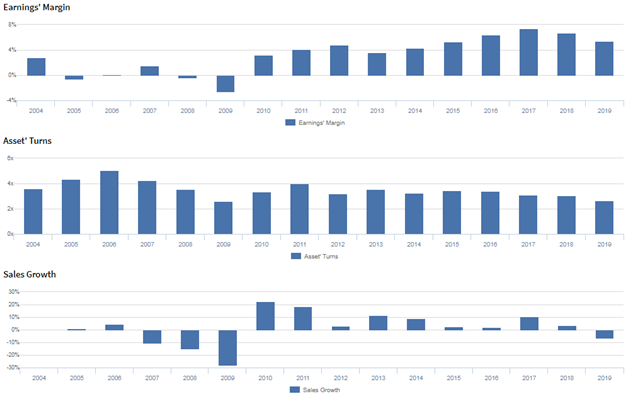
Recent declines in profitability have been driven by contracting Uniform earnings margin, supported by stable Uniform asset turns.
While Uniform earnings margins fell from 3% in 2004 to -3% in 2009, they have since steadily improved to a high of 7% in 2017 before compressing to 5% in 2019.
Meanwhile, Uniform turns, which fell from a high of 5.1x in 2006 to just 2.6x by 2009, rebounded to 4.0x in 2011, and have since continued declining to 2.7x in 2019.
At current valuations, markets are pricing in expectations for a decline in both Uniform margins and turns.
Earnings Call Forensics
Valens’ qualitative analysis of the firm’s Q3 2019 earnings call highlights that management is confident their commodity costs are around 50bps higher than in Q2 2019, and they may be concerned about further impacts to profitability from the GM strike.
Furthermore, they may lack confidence in their ability to drive efficiency through consolidating their manufacturing plants, and they may be concerned about further erosion in their E-Systems sales.
Finally, they may lack confidence in their ability to improve profitability in China, efficiently exit low-return business lines, and realize cost savings from vertically integrating their wire harness business.
UAFRS VS As-Reported
Uniform Accounting metrics also highlight a significantly different fundamental picture for LEA than as-reported metrics reflect.
As-reported metrics can lead investors to view a company to be dramatically stronger or weaker than real operating fundamentals highlight.
Understanding where these distortions occur can help explain why market expectations for the company may be divergent.
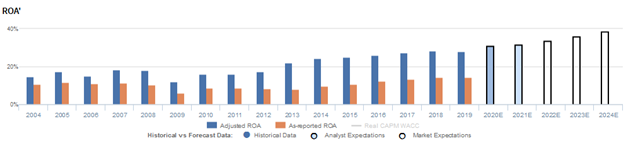
As-reported metrics significantly understate LEA’s profitability. For example, as-reported ROA for LEA was just 7% in 2019, substantially lower than Uniform ROA of 14%, making LEA appear to be a much weaker business than real economic metrics highlight.
Moreover, Uniform ROA has been at least 2x higher than as-reported ROA in each year since 2011, significantly distorting the market’s perception of the firm’s profitability.
SUMMARY and Lear Corporation Tearsheet
As the Uniform Accounting tearsheet for Lear Corporation (LEA) highlights, the firm’s Uniform P/E trades at 9.7x, which is below global corporate average valuation levels, but around its own recent history.
Low P/Es are warranted when there is relatively tame EPS growth. In the case of Lear Corporation, the company has recently shown 22% Uniform EPS shrinkage.
Wall Street analysts provide stock and valuation recommendations that in general provide very poor guidance or insight. However, Wall Street analysts’ near-term earnings forecasts tend to have relevant information.
We take Wall Street forecasts for GAAP earnings and convert them to Uniform earnings forecasts. When we do this, Lear Corporation’s Wall Street analyst-driven forecast is for 5% earnings shrinkage in 2020, inflecting positively to a 8% growth in earnings in 2021.
Based on current stock market valuations, we can back into the required earnings growth rate that would justify $107 per share. These are often referred to as market embedded expectations. In order to meet current market valuation levels of Lear Corporation, the company would only need to have Uniform earnings shrink by no more than 14% each year over the next three years.
What Wall Street analysts expect for Lear Corporation’s earnings growth is well above what the current stock market valuation requires.
Meanwhile, the company’s earnings power is 2x corporate averages, signaling that there is relatively low cash flow risk to the company’s operations and credit profile.
To conclude, Lear Corporation’s Uniform earnings growth is weak, and slightly below peer averages, and as a result, the company is justifiably trading at low, below peer average valuations.
Best regards,
Joel Litman & Rob Spivey
Chief Investment Strategist &
Director of Research
at Valens Research