This chemical producer shows how as-reported metrics can lead investors head first into value traps

Consistent price competition is a major obstacle to any commodity industry. Without sustained innovation, firms can expect to see their temporary competitive advantages deteriorate over time.
Today’s company is a leading commodity chemical producer. Although the firm was able to reap heightened profits due to its geographical diversity and growing end markets, over time it has seen its advantages wither away, but the market has yet to price in the inevitable.
Also below, the company’s Uniform Accounting Performance and Valuation Tearsheet.
Investor Essentials Daily:
Thursday Tearsheets
Powered by Valens Research
Chemical production is not the most glamorous business. It’s difficult to reap significant profits as the end products are largely commodities.
The industry revolves around price competition and identifying cost reduction opportunities that can help yield more favorable returns. Even within an industry with less existing competition, any temporary competitive advantages gradually fade over time.
This means even companies specializing in specialty chemicals can succumb to the same pressures as any commodity business.
A great example of a chemical producer that faces these struggles is LyondellBasell Industries (LYB).
The company established a leadership position in multiple commodity chemical segments, including polyethylene and polypropylene, two common plastics used in a wide array of end products.
Thanks to its geographic diversity, a function of its roots to the U.S., U.K., and the Netherlands, LyondellBasell was able to gain cost advantages and ready access to these key markets.
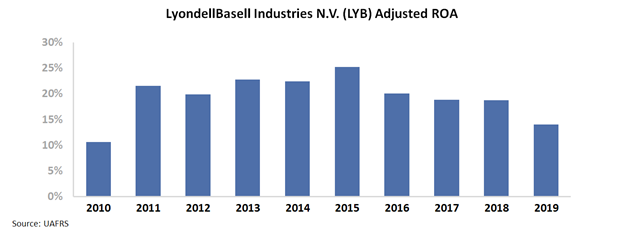
This, along with its success in picking in-demand and growing chemical markets, has led to Uniform ROA that has been generally healthy.
As seen below, the firm has maintained consistent 10%+ Uniform ROA since its emergence from bankruptcy in 2010.
While LyondellBasell has managed double-digit returns for the last decade, it has seen profitability decline slightly, with Uniform ROA fading in each of the past 5 years.
Investors might identify this trend and say that it’s no surprise the company trades at a lowly 14x P/E. This would suggest that the market is rightfully recognizing LyondellBasell to be a declining business.
If the firm were truly trading at such a meager multiple, it could even potentially be undervalued. For instance, if the firm were to just maintain its current profitability levels, equity upside could be warranted.
Investing on such a thesis would be misinformed. As-reported metrics are distorting investors perception of the firm’s current valuation.
When viewing the firm through a Uniform Accounting lens, it becomes clear that the company does not have a low 14x P/E. In reality, after as-reported distortions are removed from the firm’s earnings, LyondellBasell is actually trading at a much more lofty 24x Uniform P/E.
At these valuations, it seems that the market is not pricing the company to see its ROA decline at all. Considering the competitive pressures the firm faces, this seems to be an aggressive expectation.
Without Uniform Accounting, investors could identify this potential value trap as an attractive value play. However, once the market’s true expectations are identified, it becomes clear that LyondellBasell is nowhere as cheap as as-reported metrics suggest.
In fact, if the company sees a continued decline in profitability from present headwinds, there could be further equity downside for the name.
SUMMARY and LyondellBasell Industries N.V. Tearsheet
As the Uniform Accounting tearsheet for LyondellBasell Industries N.V. (LYB:USA) highlights, the Uniform P/E trades at 23.5x, which is around the global corporate average valuation levels and its historical average valuations.
Moderate P/Es require moderate EPS growth to sustain them. In the case of LyondellBasell, the company has recently shown a 15% Uniform EPS decline.
Wall Street analysts provide stock and valuation recommendations that in general provide very poor guidance or insight. However, Wall Street analysts’ near-term earnings forecasts tend to have relevant information.
We take Wall Street forecasts for GAAP earnings and convert them to Uniform earnings forecasts. When we do this, LyondellBasell’s Wall Street analyst-driven forecast is a 72% EPS shrinkage in 2020 and a 159% EPS growth in 2021.
Based on the current stock market valuations, we can use earnings growth valuation metrics to back into the required growth rate to justify LyondellBasell’s $97 stock price. These are often referred to as market embedded expectations.
The company can have Uniform earnings shrink by 5% per year over the next three years and still justify current stock prices. What Wall Street analysts expect for LyondellBasell’s earnings growth is below what the current stock market valuation requires in 2020, but well above what it requires in 2021.
Furthermore, the company’s earning power is twice the corporate average. However, cash flows and cash on hand are below its total obligations—including debt maturities, capex maintenance, and dividends. Together, this signals a moderate credit and dividend risk.
To conclude, LyondellBasell’s Uniform earnings growth is in line with its peer averages, while its valuations are traded below its average peers.
Best regards,
Joel Litman & Rob Spivey
Chief Investment Strategist &
Director of Research
at Valens Research


