
As-reported metrics show this franchising giant as a failure, Uniform metrics show a booming franchiser at a discount that won’t last long

Planet Fitness has been nailing the franchising strategy over the past couple of years. Its phenomenal profitability just proves how successful it already is.
Today’s company also pursued the same strategy in an attempt to boost its overall returns. Looking at the economics of the business, it is expected that this hotel giant would have gained a significant acceleration in their profits. However, as-reported metrics believe that something might have gone wrong.
Though as-reported metrics may understate the true potential of their strategies, TRUE UAFRS-based (Uniform) analysis shows that the firm has been able to reach record highs and will continue to do so in the following years.
Also below, Uniform Accounting Embedded Expectations Analysis and the Uniform Accounting Performance and Valuation Tearsheet for the company.
Investor Essentials Daily:
Tuesday Tearsheets
Powered by Valens Research
In August 2017, we added Planet Fitness (PLNT) to the Valens Conviction Long List, our list of the top 20-30 stocks to own based on our Uniform Accounting analysis and due diligence.
We loved Planet Fitness because of its successful franchising strategy and the profitability that came with it.
Generally, franchise businesses are phenomenally profitable, especially those that can grow massively. Each time a franchisee signs up, the core business gets a take of the revenue, without having to invest materially in assets.
If Planet Fitness signed up 50 new franchise locations, they would get a cut of 50 stores-worth of revenue, but their incremental costs wouldn’t increase anywhere near as fast.
If a company like Planet Fitness is able to grow successfully, it will likely see a significant ROA improvement as a result. Planet Fitness was able to do so, and that is why the name was up over 200% by the time we took it off our Conviction List this past December, barely 2 years later.
When we came across Marriott (MAR), we saw another company that was aggressively pursuing a franchising strategy. One would expect, based on the economics of a franchise business, that Marriott would see significant acceleration in returns in recent years. After all, they have been working hard to scale.
Looking at as-reported ROA for the firm, this was clearly the case from 2009 through 2015, but since then, it appears something has gone wrong:

After rising to a peak of 13% in 2015, as-reported ROA has since fallen back to 6%-7% lows. As the company has integrated its Starwood acquisition, as-reported metrics signal they’ve struggled to convert their business to a more pure-play franchising model.
But reality is quite different.
Looking through the lens of Uniform Accounting, it is clear that not only has Marriott not seen returns fade, but instead, reach record highs in recent years.
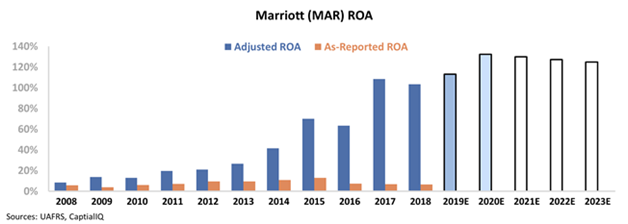
Marriott has successfully shrunk its number of owned stores, while also increasing franchises opened by over 1,000 since acquiring Starwood. As a result, Uniform ROA has skyrocketed, from 14% in 2009, to 70% in 2015, and to over 100% in the last two years.
Although market expectations look high for Marriott to see ROA at peak levels, the company is actually relatively cheap at current levels. All the firm needs to do to significantly outperform market expectations is resume what they have done the last several years as the economy starts to reopen.
This wouldn’t be apparent using as-reported metrics, but it’s made clear using Uniform Accounting. Marriott has been executing phenomenally and expanding ROA as they have, and the market thinks the company can’t do that anymore. If the company can, it has significant upside.
Even more compelling, in their most recent earnings call, management was confident about their outlook for the business, and once the economy reopens, the fundamental momentum for this business remains.
Marriott International Embedded Expectations Analysis – Market expectations are for record-high Uniform ROA, and management is confident about room signings, their resort portfolio, and expansion
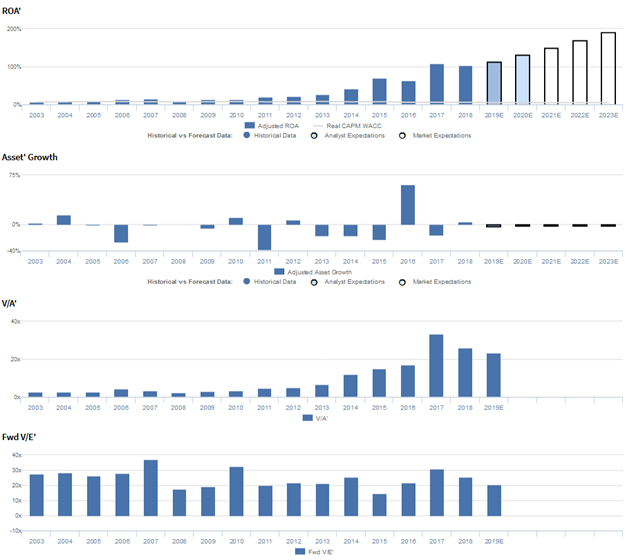
MAR currently trades above corporate averages relative to Uniform earnings with a 21.0x Uniform P/E (Fwd V/E’).
At these levels, the market is pricing in expectations for Uniform ROA to expand from 103% in 2018 to new peaks of 191% in 2023, accompanied by 2% Uniform asset shrinkage going forward.
Meanwhile, analysts have similar expectations for the firm, projecting Uniform ROA to improve 132% by 2020, accompanied by 2% Uniform asset shrinkage.
Historically, MAR has seen generally improving profitability. After expanding from 7% in 2003 to 15% in 2007, Uniform ROA compressed back to 8% in 2008, amidst recessionary headwinds.
Since then, as the firm has sold underperforming assets and acquired higher margin properties, Uniform ROA has increased exponentially, improving to 63% by 2016, before expanding further to 103%-109% levels through 2018.
Meanwhile, Uniform asset growth has been volatile, positive in just seven of the past sixteen years, while ranging from -38% to 15%, excluding 61% growth in 2016 driven by the acquisition of Starwood.
Performance Drivers – Sales, Margins, and Turns
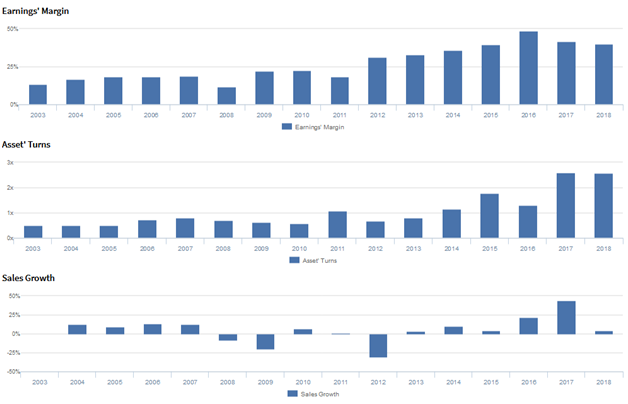
Improving profitability has been driven by compounding trends in both Uniform earnings margin and Uniform asset turns.
After expanding from 13% in 2003 to 19% in 2007, Uniform margins declined to a low of 12% in 2008. However, since then, Uniform margins have grown exponentially, reaching a peak of 49% in 2016, before regressing to 40% in 2018.
Meanwhile, Uniform turns, which were stable at 0.5x levels from 2003-2005, improved to 0.8x in 2007, before falling back to 0.6x in 2010.
Similarly, Uniform turns have improved substantially since then, improving to 1.2x in 2014, before expanding further to 2.6x peak levels in 2017-2018.
At current valuations, markets are pricing in expectations for both Uniform margins and Uniform turns to continue expanding to new peaks.
Earnings Call Forensics
Valens’ qualitative analysis of the firm’s Q3 2019 earnings call highlights that management is confident that 2019 room signings are approaching record levels, they expect adjusted EBITDA will increase to $3.57 billion, and that their group sales are stronger than more transient business categories.
In addition, they are confident about the quality of their lifestyle, luxury, and resort portfolio and that they expect unit growth outside the US to be faster than inside the US.
Furthermore, management is confident that outbound room nights sold to mainland Chinese travelers increased by 9%, with particular strength across South Korean and Malaysian destinations.
However, they are also confident that smaller portfolios have more RevPAR variability based on geography and that hotel owners seem to have apprehension about the health of the economy.
Moreover, management may lack confidence in their ability to sustain unit and managed footprint growth, maintain gross fee revenues, and mitigate pressures from RevPAR declines in Hong Kong.
Finally, they may be exaggerating the strength of their Starwood portfolio, and they may be downplaying concerns about deal abandonment and their Sheraton hotel repositioning.
UAFRS VS As-Reported

Uniform Accounting metrics also highlight a significantly different fundamental picture for MAR than as-reported metrics reflect.
As-reported metrics can lead investors to view a company to be dramatically stronger or weaker than real operating fundamentals highlight. Understanding where these distortions occur can help explain why market expectations for the company may be divergent.
As-reported metrics significantly understate MAR’s profitability.
For example, as-reported ROA for MAR was near 7% levels in 2018, materially lower than Uniform ROA of 103%, making MAR appear to perform near corporate averages, while real economic metrics highlight that their profitability is over 17x greater.
Moreover, as-reported ROA has fallen from 10%-11% levels in 2013-2014 to current 7% levels, while Uniform ROA has improved from 27% to over 100% over the same timeframe, directionally distorting the market’s perception of the firm’s historical profitability trends.
SUMMARY and Marriott International Tearsheet
As the Uniform Accounting tearsheet for Marriott International (MAR) highlights, Uniform P/E trades at 26.2x, which is above corporate average valuations and around historical average valuations for the company.
High P/Es require high EPS growth to sustain them. In the case of Marriott, the company has recently shown a Uniform EPS growth of 4%.
Wall Street analysts provide stock and valuation recommendations that in general provide very poor guidance or insight. However, Wall Street analysts’ near-term earnings forecasts tend to have relevant information.
We take Wall Street forecasts for GAAP earnings and convert them to Uniform earnings forecasts. When we do this, Marriott’s Wall Street analyst-driven forecast is for robust Uniform EPS growth of 4% in 2019, and 26% in 2020.
Based on current stock market valuations, we can back into the required earnings growth rate that would justify $84 per share. These are often referred to as market embedded expectations.
In order to meet current market valuation levels, Marriott would have to have Uniform earnings grow 11% each year over the next three years.
What Wall Street analysts expect for Marriott’s earnings growth is higher than what the current stock market valuation requires.
Meanwhile, the company’s earnings power is 17x corporate averages, and their robust cash flows and cash on hand signal that there is low risk to the company’s operations and credit profile.
To conclude, Marriott’s Uniform earnings growth is above peer averages, but the company’s price to earnings is also above peer average valuations.
Best regards,
Joel Litman & Rob Spivey
Chief Investment Strategist &
Director of Research
at Valens Research