
From the Matrix to a brand new ETF, the ‘metaverse’ has grown. Will this brand new ETF grow with it?

What was once a fun thought experiment has become an investable universe.
Today we look at a brand new ETF that holds the names essential to the ever-expanding metaverse. We use Uniform Accounting to drill into the Roundhill Ball Metaverse ETF to help you understand if it is set up for success.
In addition to examining the portfolio, we’re including a deeper look into the fund’s largest current holding, providing you with the current Uniform Accounting Performance and Valuation Tearsheet for that company.
Investor Essentials Daily:
Friday Uniform Portfolio Analytics
Powered by Valens Research
For many, The Matrix was more than just a fun movie; it was an interesting thought experiment.
If you were living in a simulation, how could you ever find out? If you couldn’t, then how would you prove that you’re not living in a simulation?
As absurd as the thought of actually living in a simulation might be, it has surprisingly deep cultural penetration. Even Elon Musk posited that it’s rather likely we are living in a simulated world.
Science educator Neil Degrasse Tyson thinks the odds are about 50/50. Academia has covered every corner of the debate. Even the British rock band Muse released an entire studio album literally called “Simulation Theory.”
While we can’t know for certain if our world is a simulated facade, we do know that software companies within our reality have been clamoring for decades to build and sell believable simulated worlds.
Early 2000s games like Sims and Second Life led to others like Minecraft, which captured the imagination of an entire generation while making a billionaire out of its founder.
The gauntlet began to truly come down with the advent of affordable virtual reality. Games like Minecraft might have tricked players into forgetting about the real world, but they didn’t make them feel as if they’re really there.
Products like the Oculus Quest 2, a sleek and easy-to-use wireless headset comparable in cost to any other modern video game console, do a phenomenal job of tricking your brain into thinking it’s somewhere it isn’t. If you haven’t tried it, you should.
All the while, movies like 2018’s Ready Player One continue to capture our imaginations about where this sort of technology could go. And where there is imagination, there is business opportunity.
The tech world thinks this theme, commonly called the “metaverse”, is still in its infancy. Oculus, for example, was acquired by Facebook for $1.6 billion in 2016, and is now a core piece of the company’s future plans.
The investment thesis for the metaverse doesn’t get much attention because there aren’t many publicly traded companies that specialize in immersive content. But most of the well-known mega cap technology firms—including Google (GOOGL), Microsoft (MSFT), Apple (AAPL), and Facebook (FB)—have made significant investments into the virtual reality space.
For the metaverse to flourish, someone will need to make the internal computing components. Someone will also need to make the games and content. As an ecosystem of products continues to emerge, a supply chain will follow, with investment opportunities at every step of the way.
However, some say that an investment theme shouldn’t be taken seriously until an ETF forms around it.
In July, the metaverse finally got real to these investors, with the inception of the Roundhill Ball Metaverse ETF (NYSEARCA:META). Although light in assets under management, the companies it has identified as key metaverse players are anything but small.
Let’s use Uniform accounting to take a look inside. We’ve conducted a portfolio audit of the Metaverse ETF’s latest holdings.
Take a look below.
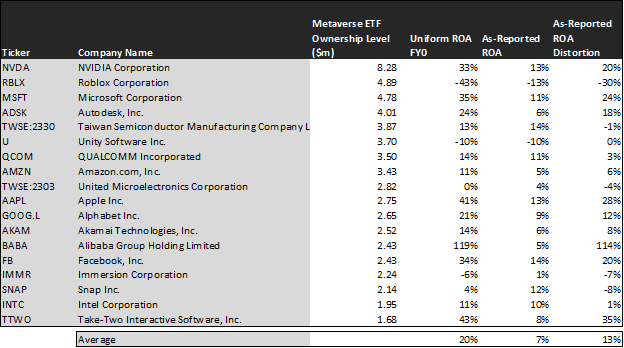
Chances are that you recognize the majority of these names, without realizing their involvement in the metaverse space. Each of them, however, develops something that is critical to the field—even if it is not their core competency.
If you were to believe as-reported accounting, you’d see this as a cost-of-capital portfolio, with a lackluster 7% ROA. This, however, wildly understates the economic productivity of these companies.
This is because the Generally Accepted Accounting Principles, or GAAP, which is the codebook by which companies must report their performance, has many fundamental flaws. Here at Valens, we have made it our mission to cut through that noise to deliver to you the real, most consistent representation of corporate profitability.
On a Uniform basis, the average ROA for these names is not 7%, but actually is 20%. This is well above the corporate average Uniform ROA of 6%.
Take a look at the ETF’s largest holding, Nvidia (NVDA). Nvidia’s ROA isn’t just 13%, but is actually at a robust 33%. The company is the clear leader in the virtual reality graphics space. In fact, nearly 90% of headsets sold in the United States rely on Nvidia GPUs.
Just finding companies with strong economic productivity isn’t enough to make them investible. To truly unlock alpha, investors need to find companies that are more productive than the market realizes.
Take a look at the chart below, which uses our embedded expectations framework to see if the market has already figured these stocks out, or if there are a number of hidden gems among them.
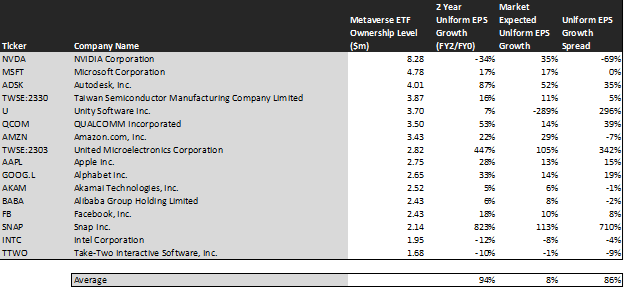
This chart shows three interesting data points:
- – The first datapoint is what Uniform earnings growth is forecast to be over the next two years, when we take consensus Wall Street estimates and we convert them to the Uniform Accounting framework. This represents the Uniform earnings growth the company is likely to have, the next two years.
- – The second datapoint is what the market thinks Uniform earnings growth is going to be for the next two years. Here, we are showing how much the company needs to grow Uniform earnings in the next 2 years to justify the current stock price of the company. If you’ve been reading our daily and our reports for a while, you’ll be familiar with the term embedded expectations. This is the market’s embedded expectations for Uniform earnings growth.
- – The final datapoint is the spread between how much the company’s Uniform earnings could grow if the Uniform Accounting adjusted earnings estimates are right, and what the market expects Uniform earnings growth to be.
With analyst forecasted average earnings growth of 94% far exceeding the priced-in expected earnings growth of 8%, this portfolio appears to be undervalued. Moreover, this is a larger dislocation than most portfolios we review.
The standout name among these is Snap (SNAP). The market is pricing in a fairly aggressive doubling of earnings over the next two years, but analysts are far more bullish. Their analysis of Snap’s opportunities and market leads them to believe that earnings will improve nine times as the company finds a sustainable path to profitability.
Snapchat sits in this portfolio because of its cutting-edge work with augmented reality graphical processing. Even if you exclude Snap, which skews the analysis, the dislocation between market expectations and analyst expectations is still 44%.
Take a look at Autodesk (ADSK). The market has priced in an earnings expansion of 52%, whereas analysts believe earnings will expand by 87%. Autodesk, the maker of the widely used CAD design software, is using virtual reality to create new ways for architects and interior designers to imagine their work.
This ETF has built a collection of companies poised to facilitate (and profit from) the coming metaverse explosion. It’s a strictly themed investment approach.
Here at Valens, our approach to unlocking alpha is different. Rather than concentrating on one theme, we pick the best stocks across the entire investing universe. If you want to know which companies we think will win based on their quality, projected growth, and current valuations, we have a report for you: The QGV 50.
Over the last 20 years, the QGV 50 has doubled the market performance. You can learn how to get access here.
SUMMARY and NVIDIA Corporation Tearsheet
As one of Roundhill Ball Metaverse ETF’s largest individual stock holdings, we’re highlighting NVIDIA Corporation’s tearsheet today.
As our Uniform Accounting tearsheet for NVIDIA Corporation (NVDA:USA) highlights, its Uniform P/E trades at 54.2x, which is above the global corporate average of 23.7x and its own historical average of 37.1x.
High P/Es require high EPS growth to sustain them. In the case of NVIDIA Corporation, the company has recently shown a 79% Uniform EPS growth.
While Wall Street stock recommendations and valuations poorly track reality, Wall Street analysts have a strong grasp on near-term financial forecasts like revenue and earnings.
As such, we use Wall Street GAAP earnings estimates as a starting point for our Uniform earnings forecasts. When we do this, NVIDIA Corporation’s Wall Street analyst-driven forecast is a 58% EPS decline in 2022, followed by a 4% EPS growth in 2023.
Based on current stock market valuations, we can back into the required earnings growth rate that would justify NVIDIA Corporation’s $204 stock price. These are often referred to as market embedded expectations.
What Wall Street analysts expect for NVIDIA Corporation’s earnings growth is below what the current stock market valuation requires in 2022 and 2023.
The company’s earnings power is 5x corporate averages. That said, intrinsic credit risk is 10bps above the risk-free rate, signaling a low credit risk.
To conclude, NVIDIA Corporation’s Uniform earnings growth is below peer averages, and the company is trading above its average peer valuations.
Best regards,
Joel Litman & Rob Spivey
Chief Investment Strategist &
Director of Research
at Valens Research