
Let’s see if meme stock investing has worked for Ryan Cohen

Investing in “meme stocks” was popularized last year with the massive short squeeze of GameStop (GME). While making investments in meme stocks, people usually join the crowd and try to profit.
However, people who are riding the crowds are the big winners of this phenomenon. As one of the most influential people in meme stock investing, Ryan Cohen hit it big with this strategy.
Let’s have a look at Ryan Cohen’s holdings to see if they are really profitable from the Uniform Accounting perspective.
In addition to examining his holdings, we’re including a deeper look into one of the fund’s largest current holdings, providing you with the current Uniform Accounting Performance and Valuation Tearsheet for that company.
Investor Essentials Daily:
Friday Uniform Portfolio Analytics
Powered by Valens Research
The meme stock investing phenomenon has boomed with GameStop (GME) and it still continues, as people on Reddit or other forums are eager to make huge profits in a short period of time.
One of the most important representatives in this strategy is none other than Ryan Cohen. His success in the GameStop rally led him to become a celebrity in the meme stock space.
When he joined the GameStop board, the stock climbed by 1,500% within just two weeks.
And he made the news last week again with a new meme stock rush.
One of his holdings was in the news for being caught up from the meme stock crowd. This time it is Bed Bath & Beyond (BBBY).
With Ryan Cohen’s initial entrance into the position due to its battered valuations and high short interest, retail investors believed they could repeat the short squeeze of GameStop.
This is exactly what happened on August 16, 2022, as BBBY shares surged 60% on the back of another short squeeze.
Shares reached a point where Cohen believed he couldn’t create any more value and exited his position.
However, this rally made Ryan Cohen a 56% profit on his initial investment in Bed Bath & Beyond.
With his successful positioning in the world of meme stocks, Ryan Cohen has built a cult following. However, his first company Chewy (CHWY) was what propelled him to fame in the first place.
While those in the meme stock crew worship him, let’s take a look at his 3 companies through a Uniform Accounting lens and see how they actually performed, and how cheap they really are as well.
Economic productivity is massively misunderstood on Wall Street. This is reflected by the 130+ distortions in the Generally Accepted Accounting Principles (GAAP) that make as-reported results poor representations of real economic productivity.
These distortions include the poor capitalization of R&D, the use of goodwill and intangibles to inflate a company’s asset base, a poor understanding of one-off expense line items, as well as flawed acquisition accounting.
It is no surprise that once many of these distortions are accounted for, it becomes apparent which companies are in real robust profitability and which may not be as strong of an investment.
See for yourself below.
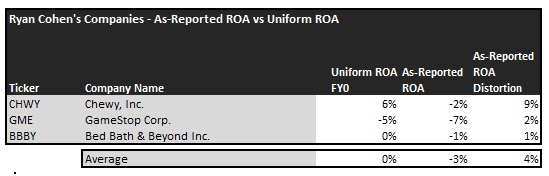
On an as-reported basis, many of these companies are not good performers in terms of profitability, operating with an average as-reported ROA of just -3%, which is significantly below the corporate averages in the United States of 12%.
Once we make Uniform Accounting (UAFRS) adjustments to accurately calculate earning power, we can see that the returns of the companies in Ryan Cohen’s holdings are much better.
The average company in the portfolio displays an average Uniform ROA of 0%, which while better, is bad news for any company.
Once the distortions from as-reported accounting are removed, we can realize that Chewy, Inc. (CHWY) doesn’t have a ROA of -2%, but returns of 6%. Meanwhile, GameStop’s (GME) ROA is actually -5%, not -7%.
To find companies that can deliver alpha beyond the market, just finding companies where as-reported metrics misrepresent a company’s real profitability is insufficient.
To really generate alpha, any investor also needs to identify where the market is significantly undervaluing the company’s potential.
These dislocations demonstrate that most of these firms are in a different financial position than GAAP may make their books appear. But there is another crucial step in the search for alpha. Investors need to also find companies that are performing better than their valuations imply.
Valens has built a systematic process called Embedded Expectations Analysis to help investors get a sense of the future performance already baked into a company’s current stock price. Take a look:
This chart shows four interesting data points:
- The Uniform ROA FY0 represents the company’s current return on assets, which is a crucial benchmark for contextualizing expectations.
- The analyst-expected Uniform ROA represents what ROA is forecasted to do over the next two years. To get the ROA value, we take consensus Wall Street estimates and convert them to the Uniform Accounting framework.
- The market-implied Uniform ROA is what the market thinks Uniform ROA is going to be in the three years following the analyst expectations, which for most companies here are 2023, 2024, and 2025. Here, we show the sort of economic productivity a company needs to achieve to justify its current stock price.
- The Uniform P/E is our measure of how expensive a company is relative to its Uniform earnings. For reference, the average Uniform P/E across the investing universe is roughly 22x.
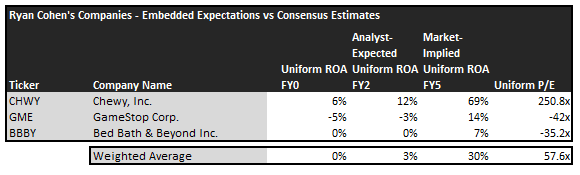
Embedded Expectations Analysis of Ryan Cohen’s holdings paints a clear picture. Over the next few years, Wall Street analysts expect these companies to slightly improve profitability, but the expectations of the market are much higher.
While analysts forecast his holdings to see Uniform ROA slightly improve to 3% over the next two years, the market is pricing the fund to see returns increase to 30% levels, which may lead to significant downside risk.
The markets are expecting Chewy’s (CHWY) Uniform ROA to rise to 69%. Meanwhile, analysts are projecting the company’s returns to increase to 12%, leading to disappointed investors.
GameStop (GME) may further disappoint investors as analysts expect their returns to slightly improve to -3% Uniform ROA, while the market expects them to increase their returns to 14%.
Even though the meme stock rallies create massive profits for some people, investing in these companies from a financial standpoint does not look really rewarding. But to continue generating alpha, investors should always consider the valuation of the companies.
This just goes to show the importance of valuation in the investing process. Finding a company with strong growth is only half of the process. The other, just as important part, is attaching reasonable valuations to the companies and understanding which have upside which has not been fully priced into their current prices.
To see a list of companies that have great performance and stability also at attractive valuations, the Valens Conviction Long Idea List is the place to look. The conviction list is powered by the Valens database, which offers access to full Uniform Accounting metrics for thousands of companies.
Click here to get access.
Read on to see a detailed tearsheet of one of Ryan Cohen’s largest holdings.
SUMMARY and Bed Bath & Beyond Inc. Tearsheet
As one of Ryan Cohen’s largest individual stock holdings, we’re highlighting Bed Bath & Beyond Inc. (BBBY:USA) tearsheet today.
As the Uniform Accounting tearsheet for Bed Bath & Beyond highlights, its Uniform P/E trades at -11.7x, which is below the global corporate average of 19.3x though above its historical average of -172.6x.
Negative P/Es only require low EPS growth to sustain them. That said, in the case of Bed Bath & Beyond, the company has recently shown a 133% Uniform EPS shrinkage.
Wall Street analysts provide stock and valuation recommendations that, in general, provide very poor guidance or insight. However, Wall Street analysts’ near-term earnings forecasts tend to have relevant information.
We take Wall Street forecasts for GAAP earnings and convert them to Uniform earnings forecasts. When we do this, Bed Bath & Beyond’s Wall Street analyst-driven forecast is for EPS to grow by 806% in 2023 and decline by 73% in 2024.
Furthermore, the company’s return on assets will decline in 2022, which is below the long-run corporate averages. Also, cash flows and cash on hand are constantly exceeding total obligations—including debt maturities and capex maintenance. Moreover, its intrinsic credit risk is 420bps. Together, these signal moderate operating and credit risks.
Lastly, Bed Bath & Beyond’s Uniform earnings growth is well-above peer averages, but is trading well-below average peer valuations.
Best regards,
Joel Litman & Rob Spivey
Chief Investment Strategist &
Director of Research
at Valens Research