
This company looks like one of my favorite stocks over the last 10 years

We were lucky that we got one of our first ideas right. Really right.
In many businesses, people want to buy only after you’ve shown you have a track record of good performance in what you do. That’s especially true when what you do is “help your clients pick stocks.” If you don’t do well there, it’s hard to hide.
One of our first ideas was a small company called Middleby.
We presented it to some of our largest hedge fund clients at the time as a compelling long, when all they were looking for were short ideas.
The reason we liked Middleby so much was their smart, strategically-acquisitive strategy. Middleby made equipment for restaurant kitchens. This business produced surprisingly strong returns once we made Uniform Accounting adjustments. While the average US company had a 10% return back in 2009, Middleby was producing a 40%+ return, 4x higher. That high return told us they were in a low competition environment.
Part of the way they were able to limit competition in the market was by being a smart strategic acquirer. They were growing their business by waiting for small mom-and-pop makers of restaurant equipment to want to sell out, as they grew older and their kids didn’t want to buy the businesses. They would buy these, and other small privately owned restaurant equipment businesses, for relatively cheap prices.
They would integrate them into Middleby’s system and boost profitability, through both cost and revenue synergies. And they would get the benefit of the acquisitions being immediately accretive, as Middleby would buy those companies for lower multiples than Middleby traded at.
We identified that the market misunderstood how profitable the firm was, and how powerful their growth strategy would be. And that happened. The stock rallied from around $15 in mid-2009 to almost $100 by early 2014 (a 500%+ return), as the market started to get savvy on Middleby’s strategy.

Middleby was in such a low competition market and could execute on this strategy for one big reason. Aside from the mom-and-pop shops, only one other company really focused on this previously boring market. Middleby was in something of a duopoly with Manitowoc.
When most people see the name Manitowoc, they think of the massive cranes you see in any picture of Asian skyscrapers going up, or of massive high rises being built in New York. But Manitowoc also is in the restaurant equipment business. They’re Middleby’s only major competitor in the space.
Or they were. Until they spun out their restaurant equipment business on its own, in 2016.
Since Welbilt (WBT) was spun out in 2016, the stock is only up slightly. Just like with Middleby back in 2009, investors don’t appear to understand how strong Welbilt’s returns are. They may not have the acquisitive growth program that Middleby has had, but they also are throwing off way more cash than investors recognize.
Because of that, there may be more fundamental room for the stock to run. Not only are the fundamentals strong, management is also showing confidence about fundamental drivers that may enable them to continue to exceed market expectations.
The 2020 Bull-Bear Market Forecast – Event this Friday in Chicago
We regularly get questions from clients in terms of where we are in the macro cycle, especially considering our Market Phase Cycle™ macro analysis has been spot on so many times over the past six years.
This Friday, there are a limited seats available for an update I’m giving in Chicago on our macro outlook.
The 2020 Bull-Bear Market Forecast.
The event is on October 25th, at 9am CST, in downtown Chicago at the Daley building at DePaul’s Driehaus College of Commerce.
There are limited seats available, so please only register if you’re sure of your availability.
To register, and read more, click here.
Markets have expectations for Uniform ROA to fall significantly, but management is confident about net income, material costs, and their Crem business.
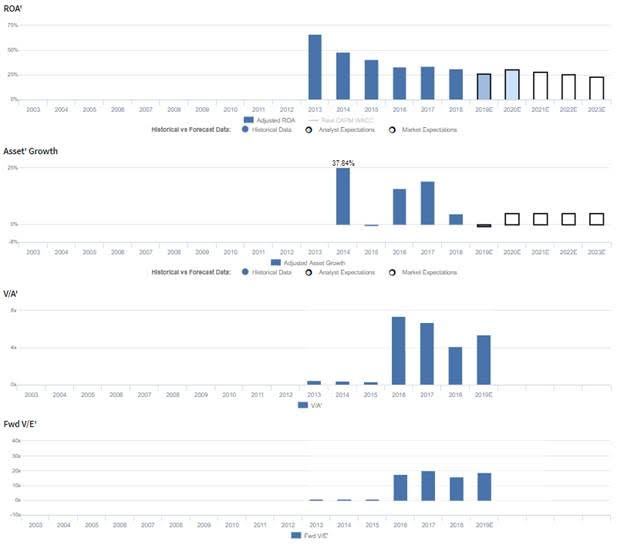
WBT currently trades slightly below corporate averages relative to UAFRS-based (Uniform) Earnings, with an 19.3x Uniform P/E. At these levels, the market is pricing in expectations for Uniform ROA to decline from 31% in 2018 to 24% by 2023, accompanied by 5% Uniform Asset growth going forward.
Analysts have less bearish expectations, projecting Uniform ROA to remain at 31% levels through 2020, accompanied by 1% Uniform Asset shrinkage.
Since their spin-off from Manitowoc, WBT has historically seen declining profitability. Since 2013, Uniform ROA has declined from 66% to current 31% levels. Meanwhile, Uniform Asset growth has been fairly strong, positive in four of the past five years, while ranging between -1% and 38%.
Performance Drivers – Sales, Margins, and Turns
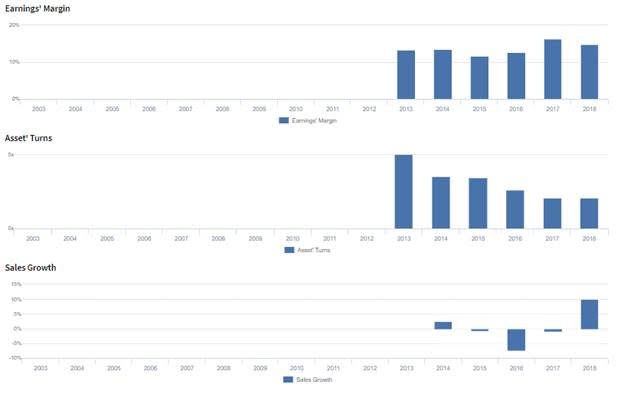
Overall declines in Uniform ROA have been driven primarily by declining Uniform Asset Turns, while generally robust profitability has been driven by strong and improving Uniform Earnings Margins. From 2013-2016 Uniform Earnings Margins ranged between 12%-14%, before improving to and stabilizing at 15%-16% levels in 2017-2018. Meanwhile, Uniform Asset Turns have compressed from peak 5.0x levels in 2013 to 2.1x in 2018. At current levels, markets are pricing in expectations for Uniform Earnings Margins to decline back to previous averages and for Uniform Asset Turns to continue compressing.
Earnings Call Forensics
Valens’ qualitative analysis of the firm’s Q2 2019 highlights that management is confident they will be able to ramp operations in their Crem business and that they will be able to meet their net income target for the year. Furthermore, they are confident material costs and tariffs will represent a smaller annual headwind than previously expected.
However, management is also confident FX was a 5.8% headwind in the quarter, and they may lack confidence in their ability to meet their cost savings targets. Moreover, they appear concerned about the sustainability of recent Merrychef high-speed oven sales growth and about their sales mix in EMEA.
UAFRS VS As-Reported
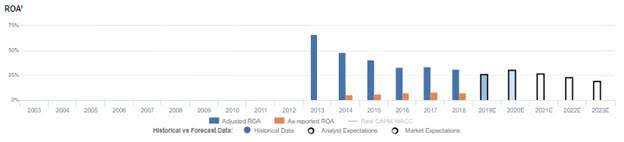
Uniform Accounting metrics also highlight a significantly different fundamental picture for WBT than as-reported metrics reflect. As-reported metrics can lead investors to view a company to be dramatically stronger or weaker than real operating fundamentals highlight. Understanding where these distortions occur can help explain why market expectations for the company may be divergent.
As-reported metrics significantly understate WBT’s profitability. For example, as-reported ROA for WBT was near 7% levels in 2018, materially lower than Uniform ROA of 31%, making WBT appear to be a much weaker business than real economic metrics highlight. Moreover, as-reported ROA has remained in the 6%-8% range since 2014 while Uniform ROA has declined from 48% to 31% over the same timeframe, distorting investors’ perception of the firm’s profitability trends.
Today’s Tearsheet
Today’s tearsheet is for Exxon Mobil. Exxon Mobil trades at a premium to market average valuations. However, at current valuations, the market is pricing in Uniform EPS growth to be below historic Uniform EPS growth. However, the company also has weak profitability levels, and low forecast growth, and high valuations, relative to peers.
Regards,
Joel Litman
Chief Investment Strategist


