
Millennium Management’s ‘fund of funds’ approach made Israel Englander the highest earning fund manager last year

While the fund of funds structure can be incredibly profitable, it also means investors end up paying double the fees.
One hedge fund has figured out a way to create the benefits of a fund of funds with the fee structure closer to a normal fund.
Today, we look at Izzy Englander’s Millennium Management.
In addition to examining the portfolio, we’re including a deeper look into the fund’s largest current holding, providing you with the current Uniform Accounting Performance and Valuation Tearsheet for that company.
Investor Essentials Daily:
Friday Uniform Portfolio Analytics
Powered by Valens Research
Many investors have looked to gain exposure to various asset classes as the bull market has surged. One asset historically out of reach for retail investors is hedge funds.
This is thanks to the regulation surrounding mutual funds and hedge funds. While hedge funds are allowed to trade in more esoteric assets, most retail investors lack the ability to buy into them because of the associated risk.
Investing directly into hedge funds requires a prohibitive amount of due diligence and understanding of the fund’s mandate. It can also lead to a concentration of risk many investors are unwilling and unable to take on due to capital requirements.
To get varied exposure without taking on direct investments in hedge funds, many individuals seek out asset managers who have the time and skill to identify a number of high quality hedge funds.
These managers perform due diligence on many different funds and put together a portfolio of funds, often called a fund of funds. Once the necessary capital has been raised, they invest large portions into individual, handpicked hedge funds.
As a result, investors are able to get better exposure to some of the top investment strategies with slightly lower concentration risk.
It’s also the only way for many retail investors to access hedge funds.
While this seems like a wonderful way to gain exposure to hedge fund style investments, there are drawbacks as well.
Investors are not just paying the fees for the hedge fund, they are also paying fees to the fund investing in different funds. The clients are paying double the fees as both hedge funds and fund of funds charge management and performance fees.
These fees end up eating into returns, and when compounded over time can have material effects on an investor’s accumulated wealth.
One cunning investor saw the value of the fund of funds structure, and he devised a way to create a fund with the benefits of the fund of funds structure and fees much closer to a traditional hedge fund.
This is what Millennium Management’s Izzy Englander was looking to accomplish by launching his fund back in 1989.
Rather than playing to a unified strategy, Millennium Management has different silos across the fund that instill various strategies and areas of focus. This enables the fund to essentially run a mini fund of funds by itself.
This allows investors the opportunity to bypass the fund of funds stacked fees.
Historically, Millennium Management has charged a steep 5%-6% management fee, coupled with a 20% performance fee. This still beats out the doubled fund of funds fees, as the fees paid to Millennium Management are the only ones investors are paying.
This process is just one reason why Izzy Englander was ranked the third best earning manager in 2020, and why he had the largest paycheck in the industry. He has built a strong and reputable fund at Millennium Management.
As a result, we believe it’s worth taking a look at the Uniform Accounting metrics of the fund. From there we will be able to decipher if Englander’s diversified group of stock pickers have made successful decisions.
We have conducted a portfolio audit of Millennium Management’s top equity holdings, based on their most recent 13-F, focusing on their non-financial company holdings.
We’re showing a summarized and abbreviated analysis of how we work with institutional investors to analyze their portfolios.
See for yourself below.
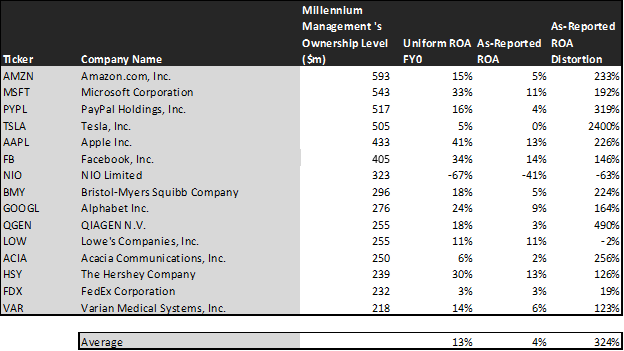
Using as-reported accounting, investors might think Millennium is buying firms with ROA levels well below the corporate average. In reality, Millennium sees through the accounting noise to pick up names markets are completely misunderstanding, often because of accounting issues.
On an as-reported basis, many of these companies are poor performers with returns below 12%, with an average as-reported ROA is around 4%.
However, once we make Uniform Accounting (UAFRS) adjustments to accurately calculate earning power, we can see that the returns of the companies in Millennium’s portfolio are much more robust.
The average company in the portfolio displays an impressive average Uniform return on assets (ROA) at 13%.
Once the distortions from as-reported accounting are removed, we can realize that Apple (AAPL) doesn’t have an ROA of 13%, but returns of 41%. It is a company with robust cash flows that Millennium thinks is still underpriced by the market.
Similarly, Facebook’s (FB) ROA is really 34%, not 14%. Millennium Management’s focus on better accounting and credit analytics recognizes a high return business with cash flows to handle obligations.
Microsoft (MSFT) is another great example of as-reported metrics mis-representing the company’s profitability.
Microsoft’s ROA isn’t 11%, it’s actually 33%. Uniform Accounting lines up with Millennium’s decision making, MSFT is really a high return business.
The list goes on from there, for names ranging from PayPal (PYPL) and Alphabet (GOOG.L), to QIAGEN (QGEN) and The Hershey Company (HSY).
If Millennium’s investment strategy was powered by as-reported metrics, it would never pick most of these companies, because they look like bad companies and poor investments.
To find companies that can deliver alpha beyond the market, just finding companies where as-reported metrics mis-represent a company’s real profitability is insufficient.
To really generate alpha, any investor also needs to identify where the market is significantly undervaluing the company’s potential.
Millennium is also investing in companies that the market has low expectations for, low expectations the companies can exceed.
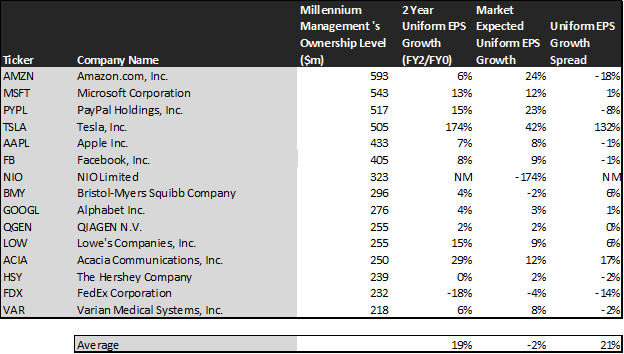
This chart shows three interesting data points:
- The 2-year Uniform EPS growth represents what Uniform earnings growth is forecast to be over the next two years. The EPS number used is the value of when we take consensus Wall Street estimates and we convert them to the Uniform Accounting framework.
- The market expected Uniform EPS growth is what the market thinks Uniform earnings growth is going to be for the next two years. Here, we show by how much the company needs to grow Uniform earnings in the next 2 years to justify the current stock price of the company. If you’ve been reading our daily analyses and reports for a while, you’ll be familiar with the term embedded expectations. This is the market’s embedded expectations for Uniform earnings growth.
- The Uniform EPS growth spread is the spread between how much the company’s Uniform earnings could grow if the Uniform earnings estimates are right, and what the market expects Uniform earnings growth to be.
The average company in the U.S. is forecast to have 5% annual Uniform Accounting earnings growth over the next 2 years. Millennium’s holdings are forecast by the market to shrink by 2%.
Meanwhile, analysts are pricing these companies to actually grow earnings by 19% a year on average. While these companies are growing faster than the market, they are intrinsically undervalued, as the market is mispricing their growth by 21%.
These are the kinds of companies that are likely to see their stocks rally when the market realizes growth potential.
One example of a company in Millennium’s portfolio that has growth potential that the market is mispricing is Tesla (TSLA). Tesla’s analyst forecast a 174% Uniform earnings growth built in, where the market is pricing the company to have earnings only grow by 42% earnings each year for the next two years.
Another company with similar dislocations is Acacia Communications. Market expectations call for a 12% growth in earnings. However, the company is actually forecast for Uniform EPS to grow by 29% a year.
Yet another example is Lowe’s (LOW). Lowe’s is priced for a 9% expansion in Uniform earnings, when they are forecast to grow by earnings by 15% a year.
For the most part, Millennium Management’s holdings are full of high quality, undervalued portfolios with stocks displaying strong earning power. This wouldn’t be clear under GAAP, but unsurprisingly Uniform Accounting and a system built to deliver alpha see the same signals.
SUMMARY and Amazon.com, Inc. Tearsheet
As Millenium Management LLC’s largest individual stock holding, we’re highlighting Amazon.com, Inc.’s tearsheet today.
As the Uniform Accounting tearsheet for Amazon.com, Inc. (AMZN:USA) highlights, the Uniform P/E trades at 44.3x, which is above the global corporate average of 25.2x and its historical P/E of 30.7x.
High P/Es require high EPS growth to sustain them. In the case of Amazon, the company has recently shown a 15% growth in Uniform EPS.
Wall Street analysts provide stock and valuation recommendations that in general provide very poor guidance or insight. However, Wall Street analysts’ near-term earnings forecasts tend to have relevant information.
We take Wall Street forecasts for GAAP earnings and convert them to Uniform earnings forecasts. When we do this, Amazon’s Wall Street analyst-driven forecasts are 13% and 14% EPS growth in 2020 and 2021, respectively.
Based on current stock market valuations, we can back into the required earnings growth rate that would justify $3,206 per share. These are often referred to as market embedded expectations.
The company can have Uniform earnings grow by 25% each year over the next three years and still justify current price levels. What Wall Street analysts expect for Amazon’s earnings growth is above what the current stock market valuation requires in 2020 and 2021.
Furthermore, the company’s earning power is 3x the corporate average. Also, cash flows and cash on hand are 2x its total obligations—including debt maturities, capex maintenance, and dividends. Together, this signals average credit and dividend risk.
To conclude, Amazon’s Uniform earnings growth is well above its peer averages, while their valuations are in line with its average peers.
Best regards,
Joel Litman & Rob Spivey
Chief Investment Strategist &
Director of Research
at Valens Research