
Not Getting Bought Might Have Been The Best Thing That Ever Happened to This Company

On November 17, 2015, Canadian Pacific (TSX:CP) offered to acquire Norfolk Southern (NSC) for $37 billion.
Up until 2014 the company had benefited from tailwinds from a rare period of strong coal exports from the US, specifically Appalachian coal out of east coast ports Norfolk’s rail lines rolled into.
The company had also benefited from the trend of shipping oil by train as the nation’s infrastructure was attempting to catch up to the shale oil & gas boom of the late 2000s and early 2010s.
But by late 2014, and into 2015, coal exports fell dramatically, and then through 2015 and 2016 the bottom fell out of the oil market.
Unlike western railroads like Union Pacific that had been dogmatically focused on operating improvements, or Canadian Pacific whose lean operating mandate had led to significant operating improvements from the late 2000s to the mid 2010s, Norfolk Southern and CSX had just ridden the benefits of the commodity cycle higher, and once it fell they weren’t prepared.
Canadian Pacific attempted to swoop in and take advantage. They planned on implementing the same improvements they had enacted to dramatically improve Norfolk Southern’s efficiency. Norfolk’s board had no interest in discussing a merger with Canadian Pacific at low prices, and so the acquisition was called off in April 2016.
Canadian Pacific’s CEO Hunter Harrison instead left the company a few years later to take over CSX, Norfolk Southern’s regional competitor on the east coast. As he started to implement the same changes he had at Canadian Pacific at CSX, Norfolk Southern had to react.
Norfolk Southern implemented the same strategies he was implementing, and would have implemented if he had also taken over the company. And shareholders massively benefitted by being able to hold the stock as the transformation took place.
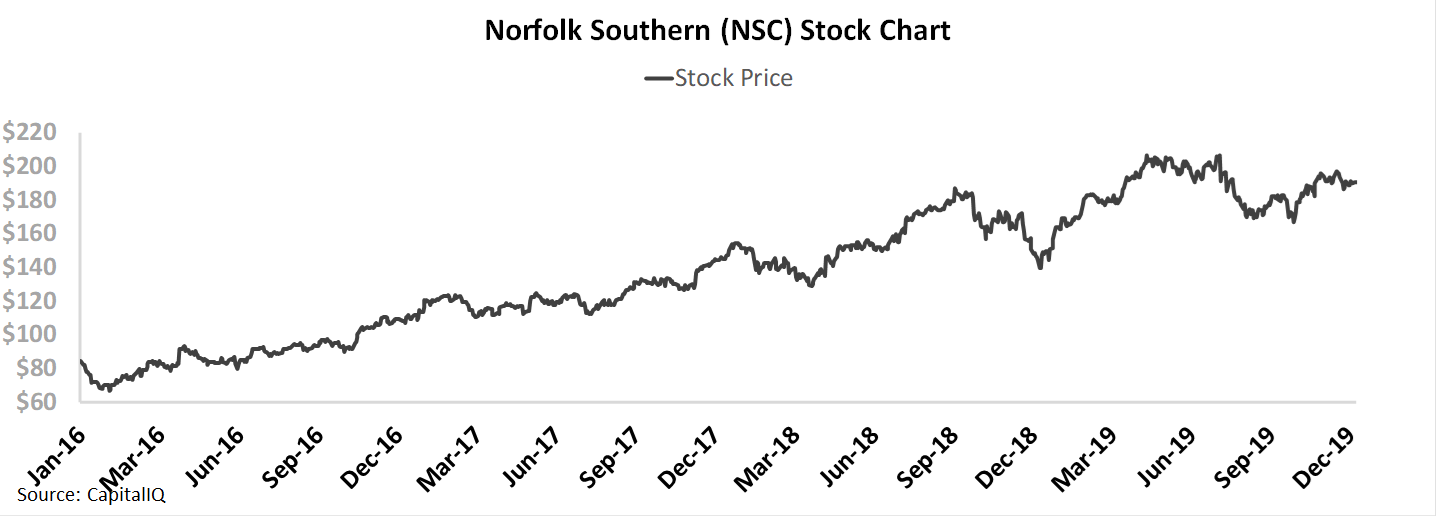
As Norfolk Southern implemented the operational improvements, the stock has risen from around $80 when the acquisition fell through to $190 now, an over 130% rise.
The company has seen a significant improvement in returns through their operational efficiency initiatives, and investors have rewarded Norfolk accordingly. However, now investors are pricing the company to continue to maintain this profitability level going forward in perpetuity, without any concern about the company’s or industry’s historical cyclicality with the economy. With management growing more concerned about sustaining efficiency improvements, driving revenue growth, and about the need to start reinvesting in the company, those expectations may now be too bullish.
Market expectations are for peak Uniform ROA, but management may be concerned about their efficiency, revenue, and expenditures
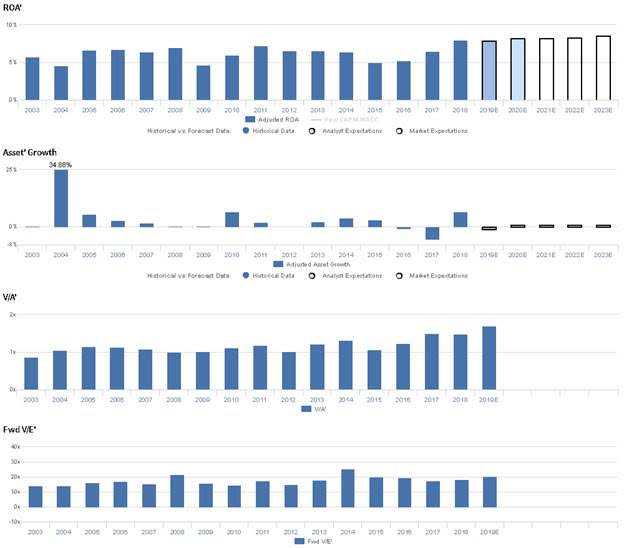
NSC currently trades above historical averages relative to UAFRS-based (Uniform) Earnings, with a 20.4x Uniform P/E. At these levels, the market is pricing in expectations for Uniform ROA to expand slightly from 8% in 2018 to 9% in 2023, accompanied by 1% Uniform Asset growth going forward.
Analysts have similar expectations, projecting Uniform ROA to sustain 8% levels through 2020, accompanied by 1% Uniform Asset shrinkage.
Historically, NSC has seen cyclical profitability near cost of capital levels. After declining from 6% in 2003 to 5% in 2004, Uniform ROA recovered to 6%-7% in 2005-2008, before compressing to 5% in 2009. Then, Uniform ROA rebounded to a historical peak of 7% in 2011, before falling to 5% in 2015-2016, and expanding to a high of 8% in 2018. Meanwhile, Uniform Asset growth has been muted, positive in 14 of the past 16 years, while ranging from -5% to 7%, excluding 35% growth in 2004 due to the acquisition of subsidiaries owned by CSX Corporation and Norfolk Southern.
Performance Drivers – Sales, Margins, and Turns
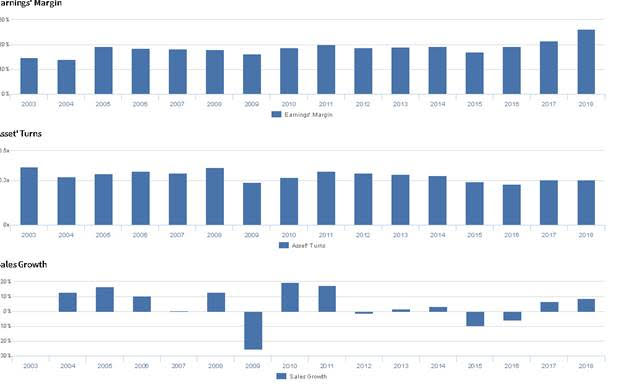
Trends in Uniform ROA have been driven primarily by trends in Uniform Earnings Margin, and stability in Uniform Asset Turns. After improving from 15% in 2003 to 18%-19% levels in 2005-2008, Uniform Margins regressed to 16% by 2009, before rebounding to 20% in 2011. Then, after stabilizing at 19% through 2014, Uniform Margins fell to 17% in 2015, but have since expanded to peak 26% levels in 2018. Meanwhile, since 2003, Uniform Asset Turns have been fairly stable, ranging from 0.3x-0.4x levels through 2017. At current valuations, markets are pricing in expectations for stability in Uniform Asset Turns and further improvement in Uniform Earnings Margin.
Earnings Call Forensics
Valens’ qualitative analysis of the firm’s Q3 2019 earnings call highlights that management is confident they are well positioned for a return to higher volumes. However, management is also confident they have realized higher expenditures due to removing freight cards from service, and they may be concerned about the level of service they provide customers. Furthermore, they may lack confidence in their ability to effectively invest in fuel efficiency and continue cutting gross ton miles from their routes. Finally, they may lack confidence in their ability to continue driving T&E productivity through 2019, and they may be concerned about the sustainability of revenue per unit improvement.
UAFRS VS As-Reported
Uniform Accounting metrics also highlight a significantly different fundamental picture for NSC than as-reported metrics reflect. As-reported metrics can lead investors to view a company to be dramatically stronger or weaker than real operating fundamentals highlight. Understanding where these distortions occur can help explain why market expectations for the company may be divergent.
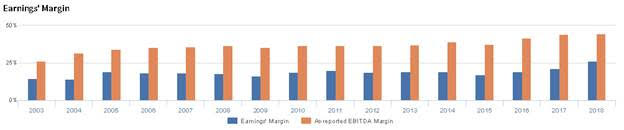
As-reported metrics significantly overstate NSC’s margins, one of the primary drivers of profitability. For example, as-reported EBITDA margin for NSC was 45% in 2018, materially higher than Uniform Earnings Margin of 26% in the same year, making NSC appear to be a much stronger business than real economic metrics highlight. Moreover, since 2004, as-reported EBITDA margin has been at least 1.5x higher than Uniform Margin, misleading investors to believe the firm has seen much more robust profitability than is accurate.
Today’s Tearsheet
Today’s tearsheet is for Thermo Fisher Scientific. Thermo trades around market average valuations. The company has recently had 4% Uniform EPS growth. EPS growth is forecast to improve to 13% in 2019, before falling back to 3% in 2020. At current valuations, the market is pricing the company to see earnings grow by 6% a year going forward.
The company’s earnings growth is forecast to be above peers in 2019, but company is trading at peer average valuations. The company has robust returns, and no cash flow risk.
Regards,
Joel Litman
Chief Investment Strategist


