One of Warren Buffett’s top reads comes from this investor, and his firm’s “knowledge advantage” becomes clearer under Uniform Accounting

Howard Marks and Oaktree have been highly respected for years. Their strategy includes looking for a “knowledge advantage” to pick the best investments, and it has been successful so far.
However, when looking at Oaktree’s portfolio under the as-reported accounting lens, it can appear at first they are just getting lucky. Their investments look relatively risky, with high valuations.
Under Uniform Accounting, we can see the real picture, and it highlights some of that knowledge advantage that made the firm so successful.
In addition to examining the portfolio, we’re including a deeper look into the fund’s largest current holding, providing you with the current Uniform Accounting Performance and Valuation Tearsheet for that company.
Investor Essentials Daily:
Friday Uniform Portfolio Analytics
Powered by Valens Research
“When I see memos from Howard Marks in my mail, they’re the first thing I open and read.”
Warren Buffett
High praise from one of the greatest, if not the greatest investors we’ve ever seen. There are few people that the Oracle of Omaha himself would listen to with bated breath, and Howard Marks, one of the founders of Oaktree Capital Management, can consider himself one of those people.
Marks has commanded this level of respect, not just from Buffett, for decades.
In 1995, after success at Citibank, and then at Trust Company of the West (TCW), Marks decided it was time to strike out on his own.
He and his group at TCW were frustrated, feeling as if they were subsidizing poor performers at TCW, and not being compensated for the massive returns they were bringing to the firm. When he finally decided to leave and start Oaktree, the respect he commanded allowed him to bring along some of the most distinguished members of the then-TCW team, including multiple managing directors.
This “brain drain” at TCW was just the beginning.
Almost immediately after Oaktree was formed, a number of major TCW clients moved over $1.5 billion from TCW to Oaktree. These clients were investing in the team, not the brand, and Marks and his team were who investors wanted to be with.
To mitigate their losses, TCW eventually came back to Marks with its tail between its legs, and worked out a deal with Marks and Oaktree. The latter would manage roughly $2.6 billion that had been managed by TCW’s former managing directors.
With assets under management, a quality team, and a reputation that preceded them, Oaktree immediately became a success. It has only built on that over the last twenty-five years.
Today, Oaktree runs over $100 billion.
Yet, while some equity investors know of Marks’ memos, and read them for their general outlook, most know very little about his stock-picking ability.
That is because he isn’t a stock-picker.
Today, less than $6 billion of Oaktree’s AUM is in equities, and most are in emerging markets. Oaktree’s niche is in credit. The firm is focused on high-yields, convertible debt, and distressed securities.
The firm is focused on finding cheap, generally senior, safer credit, in which they have a “knowledge advantage.”
That being said, we can still take a look at Oaktree’s equity portfolio, using its most recent 13-F, to provide a window into the firm’s overall philosophy. Through this lens we can show a summarized and abbreviated analysis of how we work with institutional investors to analyze their portfolios.
Unsurprisingly, while as-reported metrics of Oaktree’s investments make it look like the firm doesn’t care at all about quality or security of investment, in reality these investments appear to be safer, cheaper names, once Uniform Accounting metrics are reviewed.
It’s clear that when Oaktree is making its investment decisions, the team is making decisions based on the real data.
See for yourself below.
As we mentioned, Oaktree focuses on credit. When the fund invests in equity markets, it often is with a credit tilt in its analysis. Looking at the fund’s investments from a credit lens might help understand Oaktree’s thinking on its ideas.
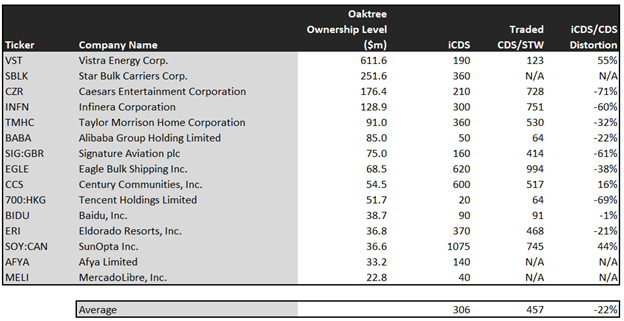
Using traded CDS or bond spreads (STW) as a proxy for balance sheet security, investors would think Oaktree is investing in high-yield, relatively unsafe credits. Many of these names have spreads that are north of 500bps, which is generally reserved for relatively high credit risks.
In a world where the US government borrows at approaching 0%, a company that has to pay above 5% interest on its bonds is high-risk.
The average spread is over 450bps.
In reality, though, using Uniform Accounting analytics, we can calculate these companies’ intrinsic credit risk. Modelling out real operating cash flows, obligations, cash liquidity, and asset backing, we can get a better understanding of how the market should price these companies’ credit risk.
Once we look through a Uniform Accounting lens, the average company displays an intrinsic credit risk (iCDS) that is at roughly 300bps. These companies’ intrinsic credit risk is 150bps safer than the market thinks. That is on the safer side of high-yield, approaching cross-over credit territory.
The intrinsic credit risk of these names is much lower than it appears looking at traded spreads. This is the “knowledge advantage” Oaktree talks about.
Once we make Uniform Accounting (UAFRS) adjustments to accurately calculate earnings power and balance sheet strength, we can more accurately price the credit risk of companies Oaktree invests in.
Infinera (INFN) isn’t a high-risk, possibly defaulting credit that warrants a 700bps+ yield on credit. Its iCDS is actually at 300bps.
Caesars (CZR) isn’t a credit risk warranting a spread of 728bps, it is nearly investment-grade safe, with an iCDS at 210bps.
The list goes on for names Oaktree invests in. If the firm just used traded credit spreads to evaluate credit risk, it’s unlikely they would be investing in half of these names. But that is the power of the “knowledge advantage.”
This advantage also helps Oaktree find names that are cheaper than investors might realize. Look at the chart below:
When looking at companies that are perceived to be “risky” it can sometimes be more valuable to look at valuations in terms of Price/Book, rather than Price/Earnings ratios. That is, looking at how much investment is required to own $1 worth of assets.
Generally, companies that are distressed trade closer to—or even below—book values in anticipation that there won’t be any recovery on those assets.
The issue with looking at valuations on earnings can be largely meaningless as high-risk companies often have weak near-term earnings.
Even though Oaktree is investing in companies that are safer than investors might realize, they’re also investing in companies that are cheaper than investors using as-reported financials realize.
Once the accounting noise is cleared up, it becomes clear that Oaktree is getting a discount on their top holdings, possibly due to exaggerated credit risk.
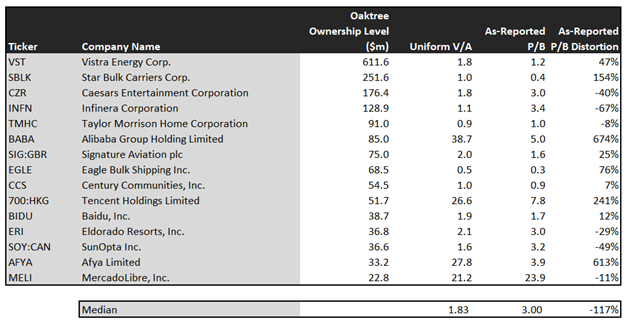
On average, the top 15 names in Oaktree’s portfolio have a UAFRS-based V/A (adjusted P/B) of 1.8x, compared to an as-reported P/B of 3.0x.
Even the risky names they invest in, like SunOpta (SOY:CAN), are trading at 1.6x, not 3.2x. Valuations 49% lower can make the risk associated with the name that much more palatable, even if it’s not trading below book values.
Infinera is trading at 1.1x assets, not 3.4x.
And the names that are trading at higher valuations than investors realize? Those names all have high returns.
Alibaba (BABA) has a UAFRS return on assets (ROA) of 136%. Tencent (700:HKG) has a Uniform ROA of 124%. AFYA has an impressive 138% ROA. Each is also low-risk credit. Oaktree isn’t overpaying for bad credit, low-return businesses, but are buying high-quality companies to balance the riskier parts of their portfolio.
Overall, it is clear Oaktree is executing on its strategy of investing with a knowledge advantage. The firm is buying names that are safer than other investors might realize and at cheaper prices than as-reported numbers show. Even the firms Oaktree invests in that are trading at a premium, are high-quality, high-return, safe businesses.
With investments this smart, no wonder Buffett listens to them.
SUMMARY and Vistra Energy Corp. Tearsheet
As one of Oaktree Capital’s largest individual stock holding, we’re highlighting Vistra Energy Corp’s tearsheet today.
As our Uniform Accounting tearsheet for Vistra Energy Corp. (VST:USA) highlights, Vistra’s Uniform P/E trades at 12.0x, which is below average valuation levels and historical average levels.
Low P/Es require low EPS growth to sustain them. In the case of Vistra, the company has recently shown a 280% Uniform EPS growth.
Wall Street analysts provide stock and valuation recommendations that in general provide very poor guidance or insight. However, Wall Street analysts’ near-term earnings forecasts tend to have relevant information.
We take Wall Street forecasts for GAAP earnings and convert them to Uniform earnings forecasts. When we do this, Vistra’s Wall Street analyst-driven forecast is a 11% and 5% decline in 2020 and 2021, respectively.
Based on current stock market valuations, we can use earnings growth valuation metrics to back into the required growth rate to justify Vistra’s $20 stock price. These are often referred to as market embedded expectations.
The company can have Uniform earnings shrink by 10% each year over the next three years and still justify current price levels. What Wall Street analysts expect for Vistra’s earnings growth is above what the current stock market valuation requires.
Meanwhile, the company’s earning power is 3x the corporate average. Also, cash flows are significantly higher than its total obligations—including debt maturities, capex maintenance, and dividends. Together, this signals low credit and dividend risk.
To conclude, Vistra’s Uniform earnings growth is below peer averages in 2020. Therefore, the company is trading below average peer valuations as well.
Best regards,
Joel Litman & Rob Spivey
Chief Investment Strategist &
Director of Research
at Valens Research


