
While these auto companies may look similar on the surface, the difference is clear under the hood

Companies in the same sector can end up having completely different returns due to competitive advantages and differing strategies. Today, we will look at two firms in the automotive aftermarket industry to see which one is more efficient.
As-reported metrics tell one story, but true UAFRS (Uniform) based analysis shows both firms’ real profitability.
Also below, the company’s Uniform Accounting Performance and Valuation Tearsheet.
Investor Essentials Daily:
Thursday Tearsheets
Powered by Valens Research
Understanding the strength of a company’s economic moats and competitive advantages is critical when evaluating businesses.
The term economic moat was coined by legendary investor Warren Buffett, and it is used to describe an advantage that is not replicable. Meanwhile, a competitive advantage is when a company produces goods or services cheaper or better than the competition.
While a competitive advantage is required to earn excess returns, an economic moat is required to maintain those excess returns. Without either of these, it’s difficult for a company to sustain positive performance for a long period of time. Eventually, other companies will end up copying a firm or becoming more efficient.
When evaluating competitive dynamics, it’s important to look at how a company compares to its peers and how it differentiates itself.
It could be that the firm offers a wider range of products than its peers. For example, Costco (COST) offers more products than most corner stores and grocery stores.
A company’s advantage could also come from targeting a specific market segment. Lowe’s (LOW) and Home Depot (HD) appear to be targeting the same home improvement market. However, Lowe’s is more focused on the do-it-yourself (DIY) market while Home Depot also caters to contractors.
Sometimes, investors need to look beyond the surface to find competitive advantages and economic moats. The competition between Advance Auto Parts (AAP) and O’Reilly Automotive (ORLY) is a great example. We talked about Advance Auto Parts last month, and now we will compare and contrast its model to O’Reilly.
They are two of the biggest aftermarket automotive part retailers, and they have been competitors for years.
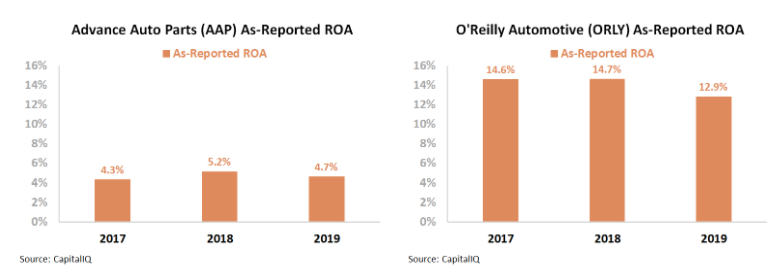
Looking at the as-reported metrics, Advance Auto Parts looks like a low quality company with weak and stagnant 4%-5% ROA. Meanwhile, O’Reilly looks like it had been able to differentiate itself in the market, driving a 15% ROA in 2017. However, while O’Reilly may have had a competitive advantage that allowed it to earn excess returns, that advantage seems to be fading.
Since 2017, O’Reilly’s ROA has fallen to just 13%, implying the company failed to find a sustainable economic moat.
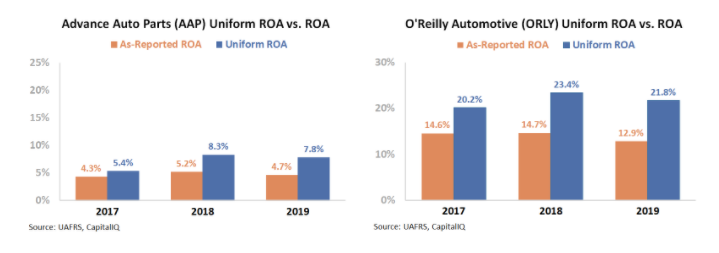
However, when digging into the Uniform numbers, we can see this is not the case. GAAP’s treatment of operating leases and accounts payable, among other distortions, are suppressing both firms’ profitability.
Uniform Accounting confirms that Advance Auto Parts has a weak performance, with Uniform ROA around 5%-8%. On the other hand, O’Reilly has been able to sustain its robust profitability, with Uniform ROA ranging between 20% and 23% since 2017.
O’Reilly clearly has an economic moat, which has been achieved through a greater focus on selling to mechanics. Although both firms service any customer who walks through the door, O’Reilly has targeted mechanics rather than DIY car repair. Mechanics are consistent customers who tend to purchase larger ticket items. Meanwhile, passionate drivers or those looking to save tend to make smaller modifications or fixes to their vehicles.
Although both firms operate in nearly identical markets, O’Reilly’s strategy has allowed it to generate a stable Uniform ROA more than double Advance Auto Parts’.
Uniform Accounting is able to show the true profitability of these two auto firms. Even when looking at more qualitative factors like economic moats and competitive advantages, it is difficult to understand them without looking at the correct numbers.
SUMMARY and O’Reilly Automotive, Inc. Tearsheet
As the Uniform Accounting tearsheet for O’Reilly Automotive, Inc. (ORLY:USA) highlights, its Uniform P/E trades at 21.6x, which is around global corporate average valuation levels but above its historical average valuations.
Moderate P/Es require moderate EPS growth to sustain them. In the case of O’Reilly, the company has recently shown a 9% Uniform EPS growth.
Wall Street analysts provide stock and valuation recommendations that in general provide very poor guidance or insight. However, Wall Street analysts’ near-term earnings forecasts tend to have relevant information.
We take Wall Street forecasts for GAAP earnings and convert them to Uniform earnings forecasts. When we do this, O’Reilly’s Wall Street analyst-driven forecast is a 35% EPS growth in 2020 and a 7% EPS decline in 2021.
Based on the current stock market valuations, we can use earnings growth valuation metrics to back into the required growth rate to justify O’Reilly’s $450 stock price. These are often referred to as market embedded expectations.
In order to justify current stock prices, the company would need to have Uniform earnings grow by 8% per year over the next three years. What Wall Street analysts expect for O’Reilly’s earnings growth is above what the current stock market valuation requires in 2020, but below that requirement in 2021.
Furthermore, the company’s earning power is 4x corporate averages. Also, cash flows and cash on hand are more than 250% its total obligations—including debt maturities and capex maintenance. Together, this signals a low credit risk.
To conclude, O’Reilly’s Uniform earnings growth is above peer averages and the company is also trading above its peer valuations.
Best regards,
Joel Litman & Rob Spivey
Chief Investment Strategist &
Director of Research
at Valens Research