
Past performance isn’t indicative of future returns, good process is, Uniform Accounting highlights this fund’s process is no longer sound

Past returns are not indicative of future performance.
It’s a mantra investors regularly hear, because any great fund manager would tell you that a sound process helps predict investment returns for the future, far better than past performance might.
Many funds’ sound process starts with looking at consistent performance and valuation metrics to identify opportunities. However, if that financial data becomes less dependable, then what used to be a sound process becomes anything but.
Our backtest analysis shows that while Uniform Accounting is still giving strong signals that a good investment process could be built off of, for the past decade as-reported metrics have no longer had any relationship with economic reality.
Because of that, one smart quantitative fund manager’s process, which initially looks “sound,” may be causing it to underperform the market because the data underlying its process is no longer right.
In addition to discussing the fund manager, we’re including a deeper look into the fund’s largest current holding, providing you with the current Uniform Accounting Performance and Valuation Tearsheet for that company.
Investor Essentials Daily:
Friday Uniform Portfolio Analytics
Powered by Valens Research
There is a line that every fund manager has in their disclosure of a fund’s performance, it says:
“Past returns are not indicative of future performance”
Funds are required to disclose this because outcomes in investing are uncertain, since you are at the whim of the market.
Because of that, even the portfolio managers and funds with the best returns tend to focus on something else when talking to prospective clients, and investment consultants and smart investors want to focus on the same thing.
Process.
The best way to understand if a fund can produce sustainable returns above the market is to understand the fund’s process. If the fund has a sound and repeatable process, it is more likely that it can continue to generate the returns it has in the past. If it doesn’t, there’s a greater chance those returns were just luck.
The best funds don’t just focus on financial metrics when looking at their process, they look at the fundamentals of a company also, to understand where the company is heading in the future and what that means for future cash flows and, therefore, future returns.
A great place to start that hunt though is in the financial metrics. Some funds look for value companies, those with low P/Es and other metrics that signal the market has low expectations. Others look for quality names, companies with strong economic moats that mean sustainable cash flow visibility. Still others focus on companies that can generate strong earnings growth, leading to compounding.
Great investors might look at several of those metrics. Warren Buffett and Berkshire Hathaway would probably argue that investors should prioritize strong economic moats and low valuations.
Akre Capital, a top performing fund the last few years that we highlighted last week, would agree with Buffet about focusing on quality, but then say growth should be a priority over valuation.
Chuck Royce and the team at Royce Funds are inherently betting on both value and growth by looking for small-cap value names. They understand that smaller companies can grow more, but still have a healthy respect for looking for companies with low valuations too.
But what if you could combine all three metrics? If each of those three variables—quality, growth, and valuation—have their merits, wouldn’t the three combined generate even stronger returns than any of the individual factors?
The data shows us the answer is “yes, but.”
Yes…but only if you use the right data.
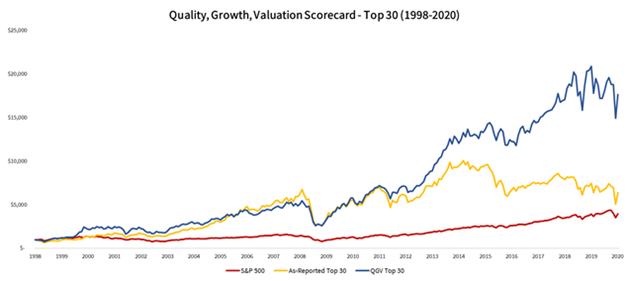
Trying to recreate what many investors view as a “holy grail” of great companies, companies that are cheaply valued, but with high quality, and high growth, we created a backtest using Uniform Accounting metrics and as-reported GAAP-based metrics. We call it the “Quality, Growth, Valuation Scorecard” backtest, or the “QGV” for short.
We looked at what would happen if we took the data from both datasets and identified the companies that best met those three criteria, either using Uniform accounting or GAAP metrics each year, for the past 22 years. Then we looked at which won.
The yellow line above is the top 30 companies if you use as-reported GAAP-based data to identify the companies with the best QGV names. While the blue line is if you use Uniform Accounting. The red line is the S&P 500.
As you can see, the Uniform portfolio trounces the GAAP-based portfolio. But that divergence has only really happened in the past 9 years. Before that, both outperformed the S&P 500. Since then, the Uniform accounting data has continued to outperform, but the as-reported data has underperformed, and the S&P 500 has “caught up.”

It appears that the quality of as-reported data is getting worse. If a fund manager is picking “QGV” companies, but doing it using as-reported metrics, and the fund is still outperforming, it is no longer because it is a good process, it is just a good outcome that’s as attributable to luck than anything else.
On the other hand, an investor using the right, Uniform Accounting data would have done more than 2x the market the past 20 years, with a stronger Sharpe and Sortino ratio. Uniform Accounting data driven investment processes still look like they are not just generating good outcomes, it is a good, sound process.
This came to mind as we were looking at the philosophy of a well-respected quantitative investing shop, O’Shaughnessy Asset Management.
The firm highlights their focus on finding companies with strong financial strength and quality, strong earnings growth, and valuation. They also look at price momentum and yield of investments.
Those first few metrics sound a lot like O’Shaughnessy is focused on a “QGV” approach to investing. And yet, the company’s funds have been lagging the market the past few years. The company’s large-cap fund has underperformed its benchmark by 1.2%, while the small-cap fund has underperformed its benchmark by 6.7%.
Perhaps O’Shaughnessy is using as-reported data to drive its quantitative models, and as the quality of that data has declined, O’Shaughnessy has seen a sound process become not quite as sound, without realizing it.
Eli Lilly and Company Tearsheet
As O’Shaughnessy Asset Management’s largest individual stock holding, we’re highlighting Eli Lilly and Company’s tearsheet today.
As our Uniform Accounting tearsheet for Eli Lilly and Company (LLY) highlights, Eli Lilly trades at a Uniform P/E of 25.8x, above corporate average valuation levels and its own recent history.
Average P/Es require average EPS growth to sustain them. In the case of Eli Lilly, the company recently had a 29% Uniform EPS shrinkage.
While Wall Street stock recommendations and valuations poorly track reality, Wall Street analysts have a strong grasp on near-term financial forecasts like revenue and earnings.
As such, we use Wall Street GAAP earnings estimates as a starting point for our Uniform Earnings forecasts. When we do this, we can see that Eli Lilly is forecast to see Uniform EPS shrinkage of 28% in 2020 followed by 23% growth in 2021.
Based on current stock market valuations, we can back into the required earnings growth rate that would justify $153 per share. These are often referred to as market embedded expectations.
In order to meet the current market valuation levels of Eli Lilly, the company would have to grow Uniform EPS by 7% each year over the next three years.
What Wall Street analysts expect for Eli Lilly’s earnings growth is far above what the current stock market valuation requires.
The company’s earning power, based on its Uniform return on assets calculation, is in line with corporate average returns. However, with cash flows and cash on hand consistently exceeding debt obligations, Eli Lilly has low credit and dividend risk.
To conclude, Eli Lilly’s Uniform earnings growth and valuation are both trading above peer averages.
Best regards,
Joel Litman & Rob Spivey
Chief Investment Strategist &
Director of Research
at Valens Research