
This Consumer Staples giant thrived in the pandemic, now it needs to keep it up, or it’ll disappoint the market

This Consumer Staples company has historically seen remarkably consistent earnings. This means investors have typically used it as a benchmark for safe investment, but with little expectation for change. That is, until this year.
As-reported metrics would have you believe this company has not improved even with a demand spike for consumer staples. True UAFRS (Uniform) based analysis shows the firm’s real profitability.
Also below, Uniform Accounting Embedded Expectations Analysis and the Uniform Accounting Performance and Valuation Tearsheet for the company.
Investor Essentials Daily:
Thursday Tearsheets
Powered by Valens Research
Consumer Staples is one of the sleepiest industries in the market. This makes sense, as people only need a set amount of these products. As such, it is rare for demand to change drastically for these companies in a short period of time.
Companies like Walmart (WMT) normally do not see same store sales rise or fall by more than low single digits. This also applies for a consumer staples manufacturer such as Clorox (CLX). Demand stays level because people typically purchase unchanging amounts of cleaning products.
However, during the pandemic, demand has surged for consumer staples. A plethora of normal, everyday items saw demand spike, which created a shortage. When stay-at-home orders began, it was nearly impossible to find toilet paper, soap, or common foods like rice.
This trend has aided many Consumer Staples companies in recent months. Businesses such as Clorox and Church & Dwight (CND) have seen their stocks appreciate immensely. As such, it makes sense investors had high hopes for Procter & Gamble’s (PG) recent earnings result.
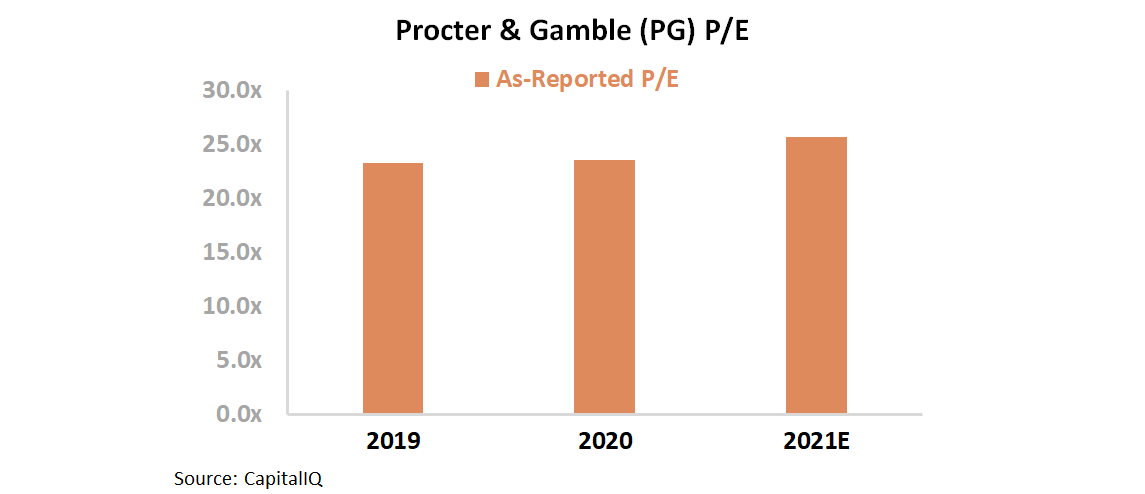
This market excitement has directly translated to Procter & Gamble’s 25.6x price-to-earnings (P/E) ratio, well above current market averages.
Investors assumed the surge in demand for consumer staples would push Procter & Gamble’s financial results higher. However, as-reported return on assets (ROA) barely improved. Returns only rose from 8% in 2019 to 9% this year.
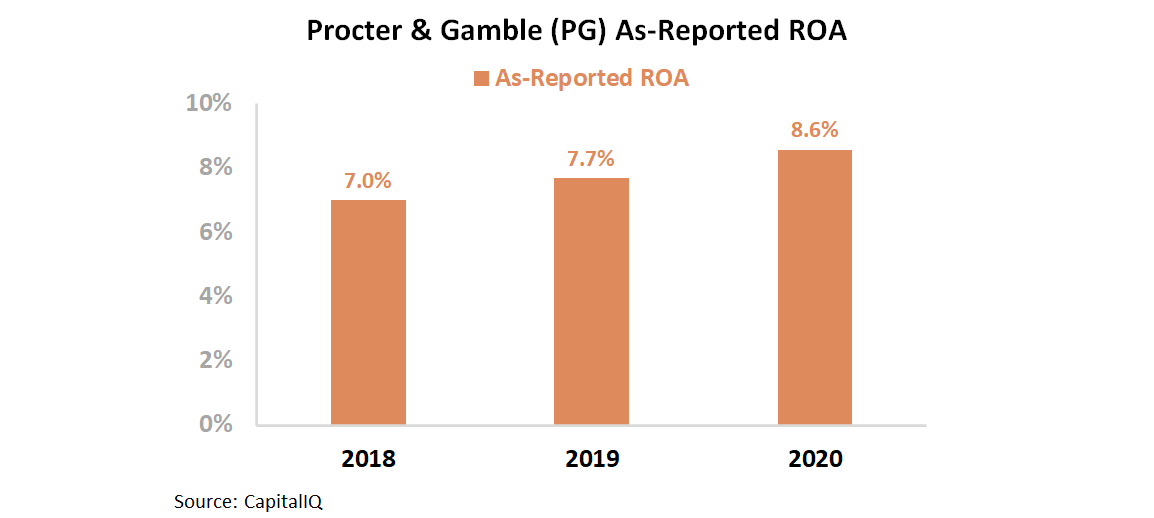
As-reported metrics have investors scratching their heads, as Procter & Gamble should have seen a significant bump in returns due to this improved demand.
This disconnect is due to the nature of GAAP accounting standards hiding this positive inflection in accounting noise. Goodwill and intangibles, among other distortions, are misrepresenting the firm’s asset base.
Uniform ROA actually improved significantly, from 23% in 2019 to 33% this year.

Uniform Accounting shows the real bump in profitability from the surge in the Consumer Staples industry that excited investors. However, the market is now expecting Procter & Gamble to continue growing through 2025. To understand market valuations further, we can use the Embedded Expectations Framework.
The chart below explains the company’s historical corporate performance levels, in terms of ROA (dark blue bars) versus what sell-side analysts think the company is going to do in the next two years (light blue bars) and what the market is pricing in at current valuations (white bars).
Sell-side analysts expect Procter & Gamble to sustain current levels over the following two years. However, the market is pricing in Uniform ROA to improve from 33% to 52% in 2025. 52% ROA is over twice as high as the firm’s returns were prior to the coronavirus-related tailwinds.
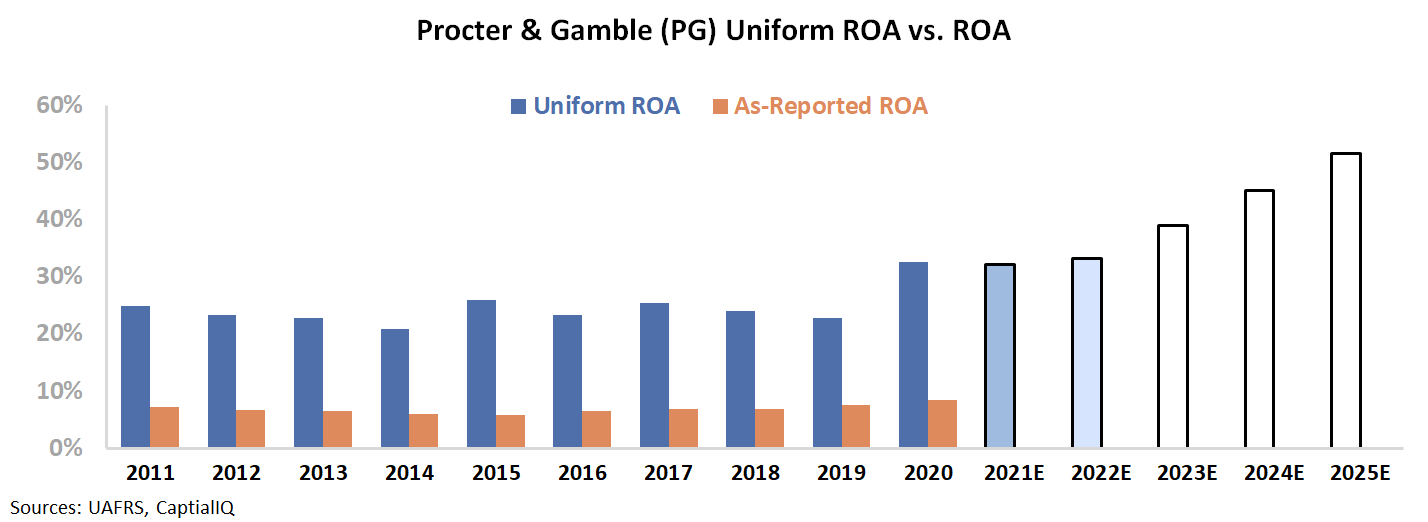
As a Consumer Staples company with little to no long-term tailwinds past coronavirus, it will be difficult to sustain improvements in ROA. Between 2005 and 2019, Procter & Gamble’s Uniform ROA never deviated from a range of 21% and 28%.
Due to recent trends, investors have forgotten the long term trends of the Consumer Staples industry, with consistent demand driven by growth rates close to GDP levels.
Uniform Accounting is able to show how Procter & Gamble did improve profitability due to coronavirus-related tailwinds. Demand for the firm’s products improved significantly and Procter & Gamble was able to improve its ROA.
However, it is also able to show the market’s expectations are extremely high, more optimistic than analyst forecasts or historical precedent dictates. Procter & Gamble would need to revolutionize operations in the next five years to justify the current share price.
That will prove even more challenging for Procter & Gamble than it was for people to find some of the company’s products in late March.
The Procter & Gamble Company Embedded Expectations Analysis – Market expectations are for significant ROA improvement, but management may be concerned about growth, productivity, and consumer spending
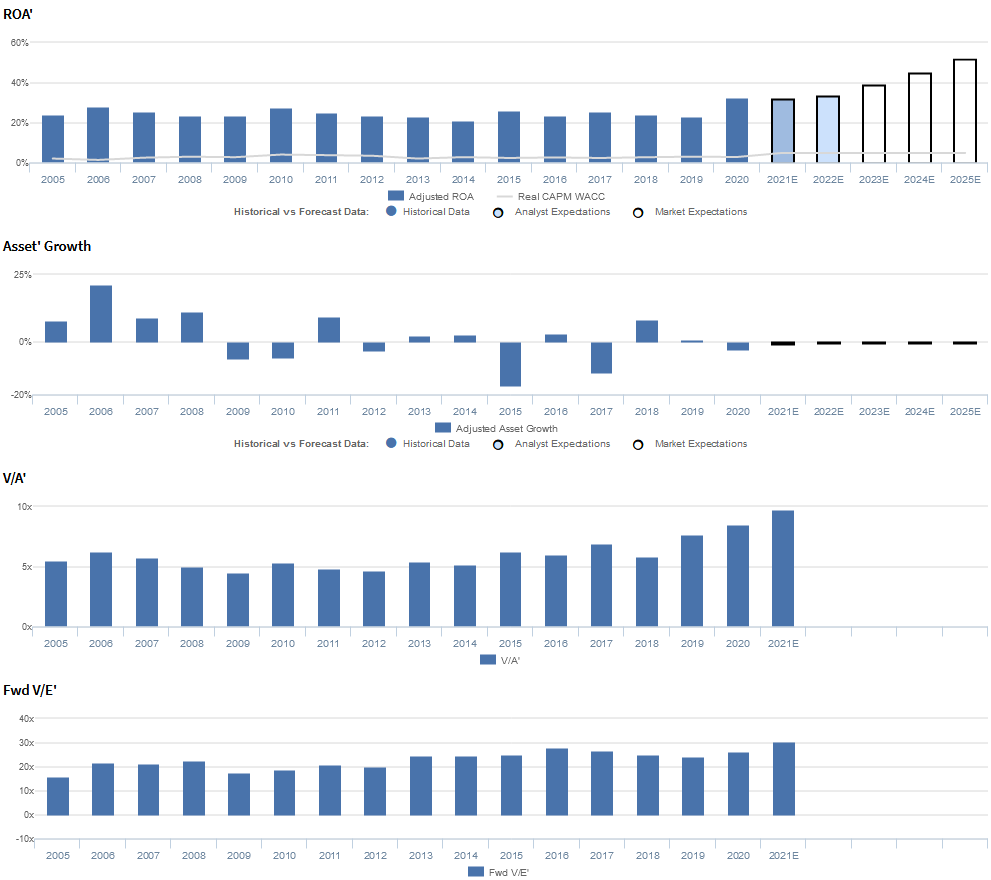
PG currently trades near historical averages relative to Uniform earnings, with a 30.3x Uniform P/E (Fwd V/E’). At these levels, the market is pricing in expectations for Uniform ROA to expand from 33% in 2020 to 52% in 2025, accompanied by 1% Uniform asset contraction going forward.
Meanwhile, analysts have less bullish expectations, projecting Uniform ROA to remain at 33% levels through 2022, accompanied by 1% Uniform asset shrinkage.
Historically, PG has seen robust, stable profitability, with Uniform ROA ranging from 21%-28% each year since 2005. After expanding from 24% in 2005 to 28% in 2006, Uniform ROA fell to 23% in 2009, amidst recessionary headwinds. Then, Uniform ROA recovered back to 28% in 2010 before contracting to 21% in 2014. Thereafter, Uniform ROA rose to 24% in 2018 and reached a peak of 33% in 2020.
Meanwhile, Uniform asset growth has been volatile, positive in only ten of the past sixteen years, while ranging from -17% to 21%.
Performance Drivers – Sales, Margins, and Turns
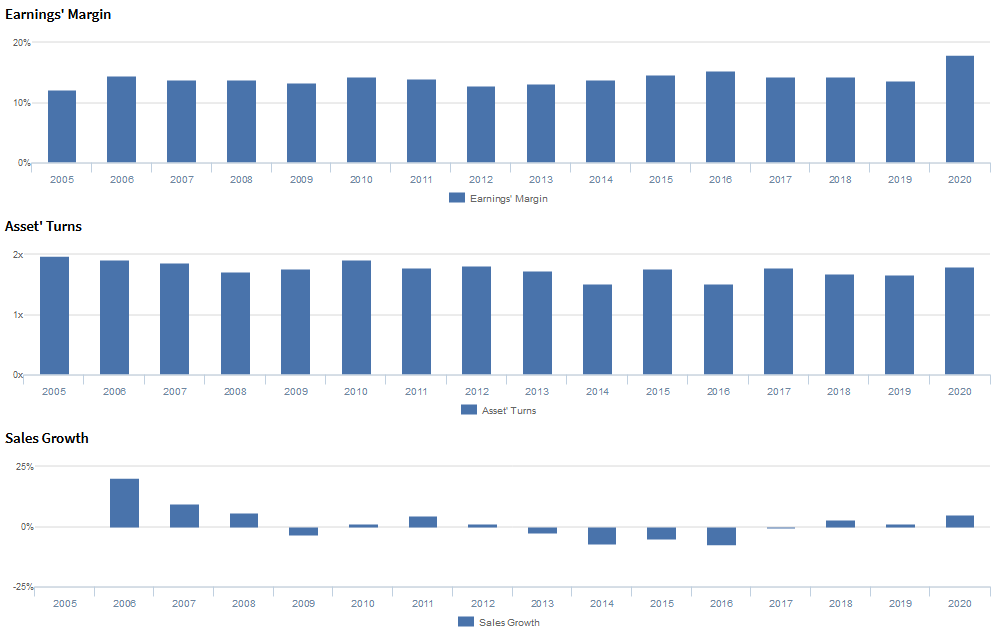
Stability in Uniform ROA has been driven by offsetting trends in Uniform earnings margins and Uniform asset turns.
Uniform margins rose from 12% in 2005 to 15% in 2006, before fading to 13%-14% levels through 2014. Thereafter, Uniform margins expanded to a peak of 18% in 2020.
Meanwhile, Uniform turns fell from 2.0x in 2005 to a low of 1.5x in 2014, before improving to and stabilizing at 1.7x-1.8x levels from 2017 through 2020.
At current valuations, markets are pricing in expectations for both Uniform margins and Uniform turns to expand to new highs.
Earnings Call Forensics
Valens’ qualitative analysis of the firm’s Q3 2020 earnings call highlights that management is confident that they are creating value through strong top-line growth and margin improvement, that at-home dynamics are driving e-commerce growth, and that they can grow both their brand and share irrespective of private label growth.
However, they may lack confidence in their ability to meet their free cash flow productivity guidance, continue to beat organic sales growth expectations, and prevent significant market share declines in their Family Care category. In addition, they may be exaggerating the progress of their productivity initiatives and the strength of their business positioning.
Moreover, they may have concerns about economic uncertainty, the sustainability of consumption increases for Bounty, Swiffer, and Mr. Clean, and their ability to raise their dividend payout ratio. Furthermore, they may lack confidence in their ability to achieve their monthly face mask production target and adapt to changing consumer habits and consumption levels.
UAFRS VS As-Reported

Uniform Accounting metrics also highlight a significantly different fundamental picture for PG than as-reported metrics reflect.
As-reported metrics can lead investors to view a company to be dramatically stronger or weaker than real operating fundamentals highlight.
Understanding where these distortions occur can help explain why market expectations for the company may be divergent.
As-reported metrics significantly understate PG’s asset turns, one of the main drivers of profitability. For example, as-reported asset turnover for PG was 0.6x in 2020, materially lower than Uniform turns of 1.8x, making PG appear to be far less efficient than real economic metrics highlight.
Moreover, since 2005, as-reported asset turnover has never exceeded 0.9x, while Uniform turns have remained above 1.5x over that timeframe, significantly distorting the market’s perception of the firm’s historical asset efficiency ceiling.
SUMMARY and Procter & Gamble Tearsheet
As the Uniform Accounting tearsheet for Procter & Gamble (PG:USA) highlights, the Uniform P/E trades at 30.3x, which is above corporate average valuation levels and historical averages.
High P/Es require high EPS growth to sustain them. In the case of Procter & Gamble, the company has recently shown a 37% Uniform EPS growth.
Wall Street analysts provide stock and valuation recommendations that in general provide very poor guidance or insight. However, Wall Street analysts’ near-term earnings forecasts tend to have relevant information.
We take Wall Street forecasts for GAAP earnings and convert them to Uniform earnings forecasts. When we do this, Procter & Gamble’s Wall Street analyst-driven forecast is an immaterial EPS shrinkage in 2021 followed by 5% growth in 2022.
Based on the current stock market valuations, we can use earnings growth valuation metrics to back into the required growth rate to justify Procter & Gamble’s $139 stock price. These are often referred to as market embedded expectations.
The company needs to have Uniform earnings grow by 7% each year over the next three years to justify current prices. What Wall Street analysts expect for Procter & Gamble’s earnings growth is below what the current stock market valuation requires.
Furthermore, the company’s earning power is 5x the corporate average. Also, cash flows are significantly higher than its total obligations—including debt maturities, capex maintenance, and dividends. Together, this signals low credit and dividend risk.
To conclude, Procter & Gamble’s Uniform earnings growth is below peer averages. However, the company is trading in line with average peer valuations.
Best regards,
Joel Litman & Rob Spivey
Chief Investment Strategist &
Director of Research
at Valens Research


