
This company is addicted to making money, and it’s only obvious using Uniform Accounting

Addictive substances have a steady demand. Today’s company focuses on nicotine and tobacco products and that means a reliable consumer base.
As-reported metrics would have you believe this company’s returns are falling because of regulation trying to squeeze its profitability, but true UAFRS (Uniform) based analysis shows the firm’s real profitability.
Also below, Uniform Accounting Embedded Expectations Analysis and the Uniform Accounting Performance and Valuation Tearsheet for the company.
Investor Essentials Daily:
Tuesday Tearsheets
Powered by Valens Research
Forbes’ yearly list of self-made billionaires is widely followed. It includes well-known CEOs, entrepreneurs, and more, from all over the world. This year’s list is headlined by the likes of Jeff Bezos, Bill Gates, and Warren Buffet.
While most of the people on the list are either former or current CEOs, founders, or family of founders, some received their money through more illicit means.
For example, there was a controversy surrounding the inclusion of Joaquin Guzman Loera, better known as El Chapo, in 2009. While he only stayed on the list for four years, both the Mexican authorities and many readers claimed he did not deserve to be on the list.
They believed it was difficult to deduce El Chapo’s true net worth. Moreover, critics said he did not deserve to be on the list because of the way he acquired his fortune.
El Chapo was the leader of a drug cartel and reportedly amassed a net worth of over $1 billion. He was not the first criminal to be added to Forbes’ list of billionaires. However, he was the first one known to be a criminal at the time.
Even as a criminal, El Chapo was able to cement his place with the wealthiest people in the world due to the size of the market for addictive substances, including illicit ones.
Unfortunately, it is a profitable business. This is because the demand for addictive substances is inelastic. Customers want the product and will pay any price for it no matter the cost.
Nicotine works in the same way. Although not illegal, it has come under heavy regulation in recent years.
Ever since nicotine came under the purview of the Food and Drug Administration (FDA) in 2009, nicotine companies have had to comply with more rules. Many of them are to ensure children do not get their hands on nicotine. These rules restrict marketing for cigarette companies, including the explicit listing of where nicotine products are sold.
Moreover, many state governments have taken matters into their own hands. 25 states either have or plan to place taxes on nicotine products. Minnesota’s is the highest at 95% of the wholesale price. Many state attorneys general have sued tobacco companies and lobbies for marketing to minors or for increasing healthcare costs.
All of these regulations have the ability to hurt companies like Philip Morris International (PM). Philip Morris is one of the largest producers of nicotine products in the world and is best known for its Marlboro brand of cigarettes.
In recent years, the firm has aimed to diversify its product line by creating reduced-risk products. For example, Philip Morris entered the vape space by creating an electronic tobacco heating system named IQOS.
However, Philip Morris still relies on cigarettes for the majority of its revenues. All the taxes and regulations that rule makers have put on the industry is to try to break smokers off the addictive habit, and test how inelastic demand really is.
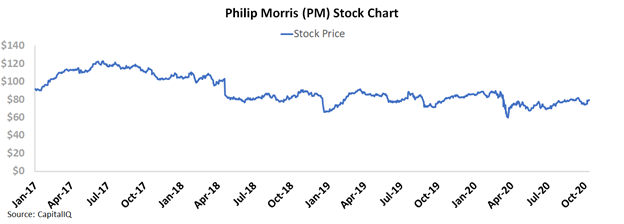
It looks like those efforts have had an effect, as the stock has fared poorly. The pressures from regulations and changing consumer habits has made investors weary about the stock. After reaching a high of over $120 in 2017, the stock price has faded to $80.
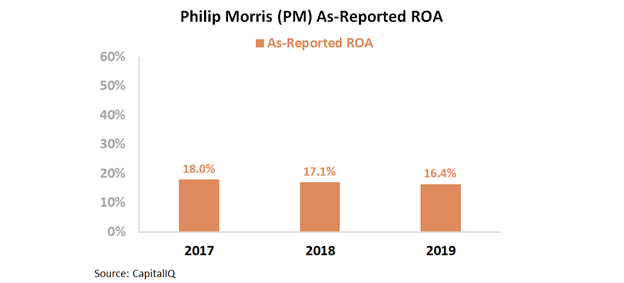
As-reported profitability metrics also appear to show regulation in the tobacco industry has curtailed the business. As-reported return on assets (ROA) fell from 18% in 2017 to 16% last year.
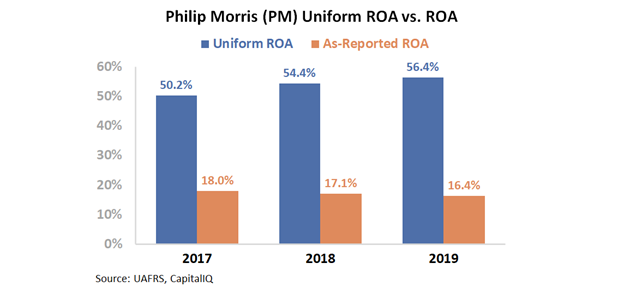
However, this picture of Philip Morris is inaccurate. GAAP’s treatment of current liabilities, goodwill & intangibles, and other distortions is inflating the firm’s asset base.
In reality, Uniform Accounting shows Philip Morris has robust profitability. Not only is Uniform ROA over twice as high as as-reported ROA, it has improved since 2017. Uniform ROA was 50% in 2017 and reached 56% in 2019.
It is easy to assume more regulation would hurt Philip Morris. However, Uniform Accounting shows the firm has been able to sustain its high returns even in the face of obstacles.
It appears one does not have to sell an illegal substance to make money. An addictive, yet legal substance still does the trick.
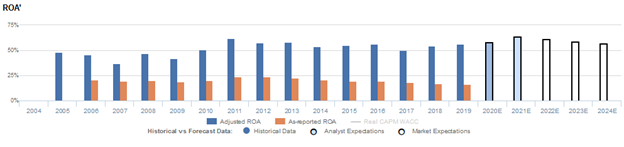
Philip Morris International Inc. Embedded Expectations Analysis – Market expectations are for Uniform ROA to remain flat, and management may have concerns about IQOS, down-trading, and international markets
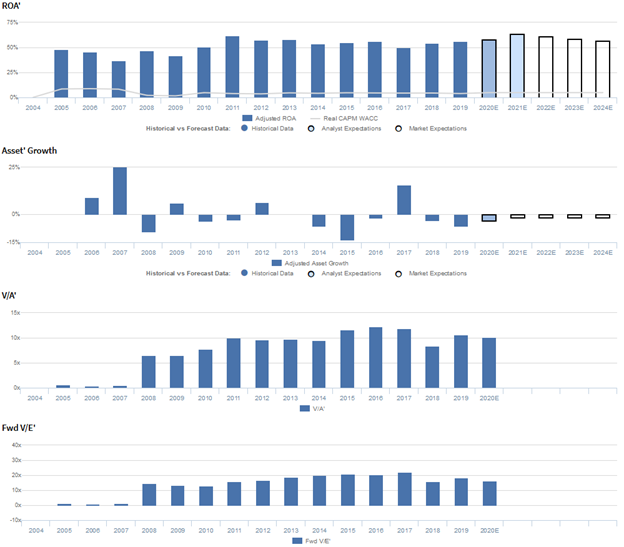
PM currently trades below recent averages relative to Uniform earnings, with a 16.4x Uniform P/E (Fwd V/E′). At these levels, the market is pricing in expectations for Uniform ROA to maintain 56%-58% levels through 2024, accompanied by 2% Uniform asset shrinkage going forward.
Meanwhile, analysts have bullish expectations, projecting Uniform ROA to rise to 64% by 2021, accompanied by 3% Uniform asset shrinkage.
Historically, PM has seen robust, generally stable profitability. After declining from 48% in 2005 to 37% in 2007, Uniform ROA rebounded to a peak of 62% in 2011 before fading to 54%-58% levels through 2019, excluding 50% underperformance in 2017.
Meanwhile, Uniform asset growth has historically been volatile, positive in just five of the past fourteen years, while ranging from -14% to 25%.
Performance Drivers – Sales, Margins, and Turns

Overall stability in Uniform ROA has been driven primarily by stable Uniform earnings margins and to a lesser extent, trends in Uniform asset turns.
Since 2005, Uniform margins have maintained 29%-33% levels, currently sitting at the low end of that range.
Meanwhile, after falling from 1.6x in 2005 to 1.3x in 2007, Uniform turns improved to 1.9x in 2011 before stabilizing at 1.8x-1.9x levels from 2012-2018, excluding 1.7x underperformance in 2017. Since then, Uniform turns have risen to a peak of 2.0x in 2019.
At current valuations, the market is pricing in expectations for stability in both Uniform margins and Uniform turns.
Earnings Call Forensics
Valens’ qualitative analysis of the firm’s Q2 2020 earnings call highlights that management may lack confidence in their ability to continue beating their diluted EPS guidance, meet their adjusted operating margin guidance, and mitigate Marlboro share declines.
In addition, they may have concerns about the coronavirus disruptions on their international markets, the sustainability of tobacco consumption recovery, and their ability to get FDA authorization for reduced-risk tobacco products.
Moreover, they may lack confidence in their ability to sustain increasing reduced-risk product market share, IQOS vape efficiency improvements, and new IQOS user acquisitions.
Furthermore, they may be downplaying concerns about the IQOS import ban in Mexico, IQOS volumes in Russia, and down-trading in the cigarette business. Additionally, management may be concerned about the excise duty system and their price positioning in Indonesia, their ability to delay price increases, and the government enforcement of a minimum retail price.
Finally, they may be exaggerating their business resiliency and the benefits of switching from cigarettes to IQOS.
UAFRS VS As-Reported
Uniform Accounting metrics also highlight a significantly different fundamental picture for PM than as-reported metrics reflect.
As-reported metrics can lead investors to view a company to be dramatically stronger or weaker than real operating fundamentals highlight. Understanding where these distortions occur can help explain why market expectations for the company may be divergent.
As-reported metrics significantly understate PM’s profitability. For example, as-reported ROA for PM was 16% in 2019, substantially lower than Uniform ROA of 56%, making PM appear to be a much weaker business than real economic metrics highlight.
Moreover, since 2007, as-reported ROA has faded from 20% to 16%, while Uniform ROA has expanded from 37% to 56%, directionally distorting the market’s perception of the firm’s historical profitability trends.
SUMMARY and Philip Morris International, Inc. Tearsheet
As the Uniform Accounting tearsheet for Philip Morris International Inc. (PM:USA) highlights, its Uniform P/E trades at 16.4x, which is below global corporate average valuation levels and its historical average valuations.
Low P/Es require low EPS growth to sustain them. In the case of Philip Morris, the company has recently shown a 6% Uniform EPS decline.
Wall Street analysts provide stock and valuation recommendations that in general provide very poor guidance or insight. However, Wall Street analysts’ near-term earnings forecasts tend to have relevant information.
We take Wall Street forecasts for GAAP earnings and convert them to Uniform earnings forecasts. When we do this, Philip Morris’ Wall Street analyst-driven forecast an EPS growth of 3% and 14% in 2020 and 2021, respectively.
Based on the current stock market valuations, we can use earnings growth valuation metrics to back into the required growth rate to justify Philip Morris’ $79 stock price. These are often referred to as market embedded expectations.
The company can have its Uniform earnings shrink by 4% per year over the next three years and still justify current prices. What Wall Street analysts expect for Philip Morris’ earnings growth is above what the current stock market valuation requires in 2020 and 2021.
Furthermore, the company’s earning power is 9x the corporate average. Also, cash flows and cash on hand are above its total obligations—including debt maturities, capex maintenance, and dividends. Together, this signals low credit and dividend risk.
To conclude, Philip Morris’ Uniform earnings growth is above peer averages, but the company is trading below peer values.
Best regards,
Joel Litman & Rob Spivey
Chief Investment Strategist &
Director of Research
at Valens Research