
Breaking up conglomerates adds value, the market hasn’t cared about this break-up, Uniform Accounting shows it should

GE, Tyco, United Technologies. They’ve all spun-off massive parts of their business to create value. Activist funds like Elliott Management make money guiding firms to getting leaner. The conglomerate discount is real.
So why has this company underperformed recently? It has followed the same path, but returns don’t appear to have trended the right direction. Did they screw it up? Or is the accounting masking a successful streamline?
Also below, Uniform Accounting Embedded Expectations Analysis and the Uniform Accounting Performance and Valuation Tearsheet for the company.
Investor Essentials Daily:
Tuesday Tearsheets
Powered by Valens Research
In the U.S., conglomerate discounts are real. This HBR article highlights that that discount could range anywhere from 6% to 12% for a given conglomerate, on average. It could be even higher now.
Firms and activist investors have taken note.
Recently, United Technologies spun off Otis Worldwide and Carrier, to focus their business on Aerospace and Defense, rather than elevators and HVAC solutions.
Before that, GE sold its massive BioPharma business to Danaher, its stake in NBCUniversal to Comcast, and its GE Transportation business to Wabtec.
And before that, it was companies like Tyco, who spun-off Covidien and Tyco Electronics in 2006.
All of those transactions were worth tens of billions of dollars, as the sellers focused on simplifying their businesses, and streamlining around a core concept.
This has been embraced by management teams who agree managing a massive conglomerate is inefficient, by boards who realize it reduces shareholder value, and shareholders who recognize the amount of value that can be unlocked by streamlining.
In 2013, this theory was embraced by PPG Industries, a chemicals company.
The firm recognized the need to focus on its paints and coatings business and made a series of moves aimed at streamlining, allowing it to focus on a more value-add part of its business.
It sold its commodities chemicals business to Georgia Gulf in 2013 for $2 billion.
The company followed this up with a sale of its stake in Transitions Optical for $1.7 billion in 2014.
Finally, it sold its Flat Glass facilities, and Pittsburgh Glass Works in 2016, for a total over $1.3 billion.
Over $4 billion in sales over three years, all aimed at streamlining and adding value.
But the as-reported numbers would suggest this strategy hasn’t worked.
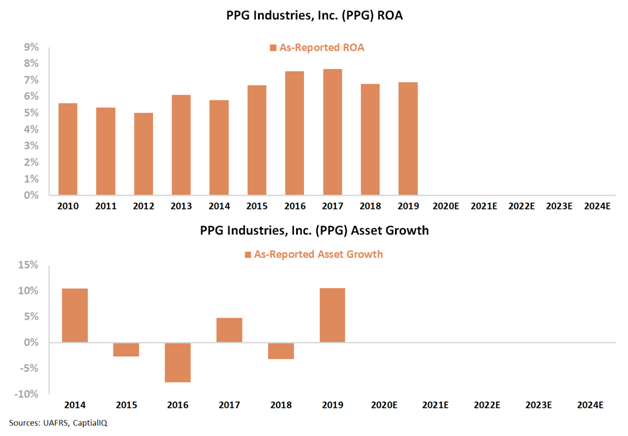
Even with material balance sheet shrinkage in recent years, PPG has seen ROA remain flat around 7%, failing to improve as it shrunk.
Investors are therefore pessimistic about the firm. If a company shrinks, but doesn’t improve returns, it’s a negative for shareholders. In fact, shares have been roughly flat since the end of 2013, clearly there is pessimism around the firm’s results.
But the as-reported metrics mask the real story of the firm.

In reality, the firm’s ROA has jumped from ~7% pre-2013, to 13%-15% in recent years. It was able to correctly focus the business, and remove inefficiencies, leading to much greater profitability. Analysts project this to continue. It wasn’t a flash in the pan.
However, after prices have fallen nearly 50% from peaks, markets are pricing in expectations for returns to start to fade back to prior levels. Although management appears to have concerns about near-term headwinds for the business, this suggests markets might be overly pessimistic in the long run, driven by as-reported accounting issues masking the real strength of this business.
PPG Industries Embedded Expectations Analysis – Market expectations are for Uniform ROA to reach new peaks, but management may be concerned about sales volume, growth, and M&A
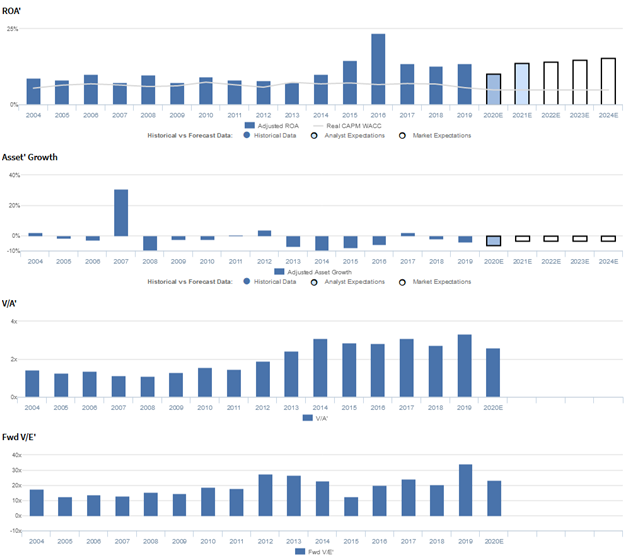
PPG currently trades below corporate averages relative to Uniform earnings, with a 23.3x Uniform P/E (Fwd V/E’).
At these levels, the market is pricing in expectations for Uniform ROA to expand from 14% in 2019 to a peak of 16% through 2024, accompanied by 3% Uniform asset shrinkage going forward.
Meanwhile, analysts have similar expectations, projecting Uniform ROA to sustain 16% levels through 2021, accompanied by 6% Uniform asset shrinkage.
Historically, PPG has seen somewhat stable, but generally improving profitability. Uniform ROA ranged from 7% to 10% from 2004-2013, before expanding to a peak of 15% in 2016, as the firm divested underperforming glass and fiberglass assets.
Since then, Uniform ROA has faded slightly to 14% in 2019.
Meanwhile, as the firm has continued to rationalize its portfolio, Uniform asset growth has been muted, positive in just five of the past sixteen years, while ranging from -10% to 6%, excluding 21% growth in 2007, due to their acquisition of SigmaKalon.
Performance Drivers – Sales, Margins, and Turns
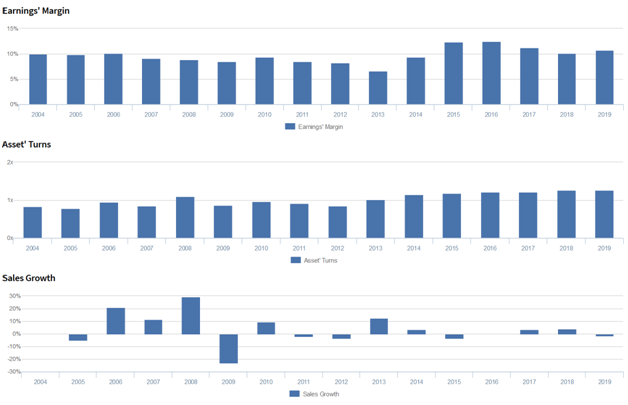
Trends in Uniform ROA have been driven by improvements in both Uniform earnings margin and Uniform asset turns.
After fading from 10% in 2004-2006 to 7% in 2013, Uniform margins expanded to 12%-13% levels in 2015-2017, before compressing to 11% in 2019.
Meanwhile, Uniform turns ranged between 0.8x and 1.1x in 2004-2014, and subsequently expanded to a peak of 1.3x in 2019.
At current valuations, markets are pricing in expectations for both Uniform margins and Uniform turns to expand to new peaks.
Earnings Call Forensics
Valens’ qualitative analysis of the firm’s Q3 2019 earnings call highlights that management is confident positive developments around regional and country trade disputes could provide a spark to industrial demand and that the aluminum packaging industry has some tailwinds going into next year.
In addition, they are confident they have been carrying extra cash and earnings on that cash in Q3.
However, management is also confident sales volume was down as a result of weak production across most of their general industrial end markets and that their Chinese and other Asian auto OEM volumes underperformed significantly.
Moreover, they may lack confidence in their ability to sustain above-market growth in their PPG timeless product line, beat year-over-year and quarterly aerospace sales comps, and gain market share in Europe.
Furthermore, management may be concerned about farmer spending trends, their capital expenditures, and the size of their M&A transactions.
Finally, they may lack confidence in their ability to sustain cash flows and realize higher selling prices in each major region.
UAFRS VS As-Reported
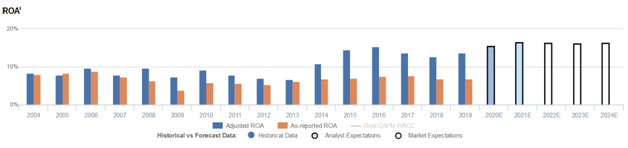
Uniform Accounting metrics also highlight a significantly different fundamental picture for PPG than as-reported metrics reflect.
As-reported metrics can lead investors to view a company to be dramatically stronger or weaker than real operating fundamentals highlight.
Understanding where these distortions occur can help explain why market expectations for the company may be divergent.
As-reported metrics significantly understate PPG’s profitability.
For example, as-reported ROA for PPG was 7% in 2019, substantially lower than the Uniform ROA of 14% that year, making PPG appear to be a much weaker business than real economic metrics highlight.
Moreover, since 2013, as-reported ROA has remained at 6%-8% levels since 2013, while Uniform ROA expanded from similar levels to 14%, making the firm’s recent portfolio rationalization seem much less accretive than is accurate.
SUMMARY and PPG Industries, Inc. Tearsheet
As the Uniform Accounting tearsheet for PPG Industries (PPG) highlights, Uniform P/E trades at 23.3x, which is above corporate average valuations but below the company’s historical average valuations for the company.
High P/Es require high EPS growth to sustain them. In the case of PPG Industries, the company has recently shown a robust Uniform EPS growth of 7%.
Wall Street analysts provide stock and valuation recommendations that in general provide very poor guidance or insight. However, Wall Street analysts’ near-term earnings forecasts tend to have relevant information.
We take Wall Street forecasts for GAAP earnings and convert them to Uniform earnings forecasts. When we do this, PPG Industries’ Wall Street analyst-driven forecast is for Uniform EPS shrinkage of 31% in 2020, and 43% growth in 2021.
Based on current stock market valuations, we can back into the required earnings growth rate that would justify $92 per share. These are often referred to as market embedded expectations.
In order to meet current market valuation levels, PPG Industries would have to have Uniform earnings shrink 2% each year over the next three years.
What Wall Street analysts expect for PPG Industries’ earnings growth is higher than what the current stock market valuation requires.
Meanwhile, the company’s earnings power is 2x corporate averages, and their robust cash flows and cash on hand signal that there is low risk to the company’s operations and credit profile.
To conclude, PPG Industries’ Uniform earnings growth is below peer averages, but the company’s price to earnings is in line with peer average valuations.
Best regards,
Joel Litman & Rob Spivey
Chief Investment Strategist &
Director of Research
at Valens Research


