
Raising prices isn’t the only way to improve earning power, this cable company showed the power of selling more to the same customer base

Asset-intensive industries like telecom and cable require specific solutions to drive stronger returns.
This company was able to make smart investments to get the most out of its fixed asset base, and its returns have followed suit.
Also below, Uniform Accounting Embedded Expectations Analysis and the Uniform Accounting Performance and Valuation Tearsheet for the company.
Investor Essentials Daily:
Tuesday Tearsheets
Powered by Valens Research
In asset-intensive industries, it can be difficult to react quickly to changing market environments. This is why many companies today have chosen to adopt “lean” and “asset-light” mentalities.
However, that’s not always possible.
There are companies in many industries that cannot simply trim their asset bases without severely damaging their operations.
For example, high fixed-asset industries like industrial manufacturing and telecom require large initial investments. The best way to improve their business is by generating more revenue with those investments.
It just so happens that these industries also tend to be hyper-competitive.
The large fixed investments may mean barriers to entry for those not already in the business. It also means someone who already invested in the industry has every reason to try to “make it work.”
As a result, in an asset-intensive industry like telecom, companies try to maximize their return by selling as many products with the asset base they have.
Thinking back to the DuPont Formula for calculating return on assets (ROA), companies with fixed asset bases can attempt to improve returns by improving asset turnover if margins are less flexible.
Comcast (CMCS.A) is a great example of a company who made the most of its assets by finding new ways to monetize its assets.
After starting out as a local cable company in the 1960s, Comcast focused on one of the most important metrics in the cable industry: homes passed.
It focused on building out its cable network both organically and acquisitively to connect to as many homes as possible. By doing so, Comcast was able to maximize its number of potential customers.
The company’s investments paid off—Comcast became one of the largest cable providers in the country.
However, in order to improve ROA, the company could not rely on growth alone.
In the following years, Comcast made a number of strategic investments that added to the ways the company could boost revenue from its assets.
From its acquisition of American Cellular Network Corporation to its introduction of home internet in 1996, Comcast added more products to sell to customers while using the same cable lines.
Comcast went from a cable company to a cable and internet company, to a full service cable, internet, and voice over IP offering for individuals and businesses.
It achieved geographic monopolies thanks to its consolidation of the space that helped it boost prices.
This strategy steadily improved Comcast’s Uniform earning power.
Then in 2011, Comcast bought NBC Universal.
This was yet another way for the company to improve its asset utilization, and it showed.
Comcast now owned the content it was broadcasting.
It could better target ads on that content, profit from selling that content to others, and better optimize its offerings.
Since the content business is a less asset-intensive business, Comcast saw its Uniform earning power improve significantly.
As-reported metrics don’t fully show how successful Comcast’s strategy has been.
When looking at the company’s as-reported ROA, it appears its monetization efforts have started reversing with the cutting of the cord.
The dreaded unbundling of Comcast’s cable bundles at high prices has seemingly started to cause the business to break down. ROA is thought to have peaked at 6% in 2014-2017 and reversed back to 5% in 2018.
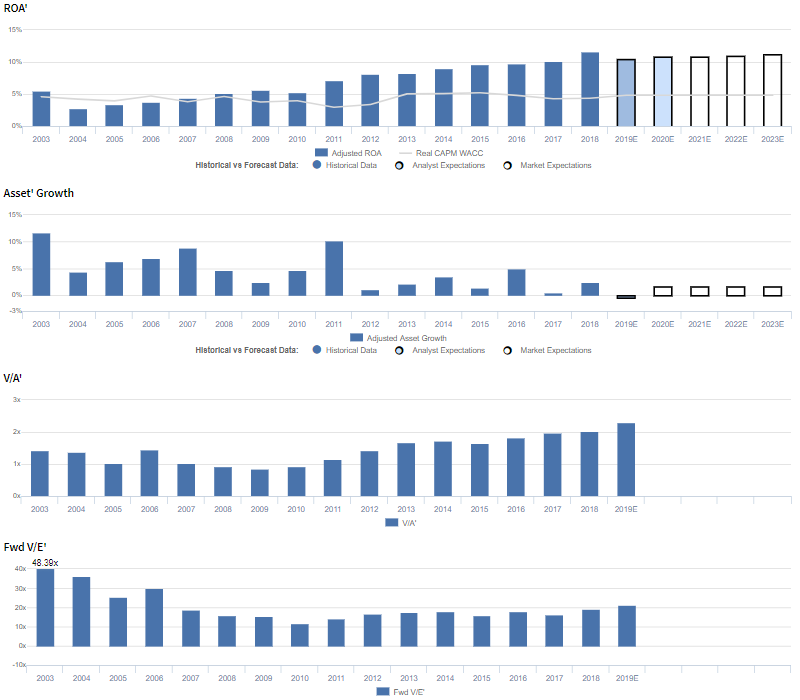
In reality, on a Uniform Accounting basis, returns have kept rising. Uniform ROA reached an all-time high of 12% in 2018.

Investors appear to realize the as-reported ROA of the business is wrong—market expectations are for returns to remain stable going forward.
Since the time as-reported ROA started to decay, the stock has risen from $28 to $45.
While this is a good sign for the company, the recent run-up in the market signals that near-term upside may be limited unless the company can continue to expand Uniform earning power.
Given management’s recent lack of confidence about their outlook on important factors like customer additions, costs, and rising competition, Comcast may actually be reaching a near-term end of the road for their return expansion strategy.
Comcast Corporation Embedded Expectations Analysis – Market expectations are for slight Uniform ROA compression, and management may be concerned about net customer additions, their programming expense, and OTT competition
CMCS.A currently trades near corporate averages relative to Uniform Earnings, with a 21.1x Uniform P/E (Fwd V/E′).
At these levels, the market is pricing in expectations for Uniform ROA to compress from 12% in 2018 to 11% in 2023, accompanied by 2% Uniform Asset growth going forward.
Analysts have similar expectations, projecting Uniform ROA to compress to 11% by 2020, accompanied by immaterial Uniform Asset shrinkage.
Historically, CMCS.A has seen improving profitability since acquiring AT&T Broadband in the early 2000s.
After declining from 6% in 2003 to 3% in 2004, Uniform ROA consistently expanded to 12% in 2018. Meanwhile, Uniform Asset growth has been consistent, positive in each of the last 16 years, while ranging from 0%-12%.
Performance Drivers – Sales, Margins, and Turns

Improvements in earning power have been driven by compounding trends in both Uniform earnings margin and Uniform asset turns.
After falling from 19% in 2003 to 10% in 2004, Uniform earnings margin steadily expanded to 17% by 2018.
Meanwhile, Uniform asset turns showed similarly improving trends, expanding from 0.3x in 2003 to 0.7x in 2018.
At current valuations, markets are pricing in expectations for both Uniform earnings margin and Uniform asset turns to remain near current levels.
Earnings Call Forensics
Valens’ qualitative analysis of the firm’s Q3 2019 earnings call highlights that management is confident their performance this quarter is indicative of their business strength.
However, they may be concerned about the positioning of the spectrum team, and they may lack confidence in their ability to sustain recent net customer additions.
Furthermore, they may be concerned about the sustainability of flat programming expenses, and they may lack confidence in their ability to shift their business toward connectivity.
In addition, they may lack confidence in their ability to strengthen their leading competitive position and sustain improvements to their capital intensity efficiency.
Finally, they may be exaggerating expectations for growth in the broadband market, and they may be concerned about rising OTT competition.
UAFRS VS As-Reported

Uniform Accounting metrics also highlight a significantly different fundamental picture for CMCS.A than as-reported metrics reflect.
As-reported metrics can lead investors to view a company to be dramatically stronger or weaker than real operating fundamentals highlight.
Understanding where these distortions occur can help explain why market expectations for the company may be divergent.
As-reported metrics significantly understate CMCS.A’s earnings margin, one of the key drivers of profitability.
For example, as-reported EBITDA margin for CMCS.A was near 32% in 2018, substantially higher than Uniform earnings margin of 17%, making CMCS.A appear to be a much stronger business than real economic metrics highlight.
Moreover, as-reported EBITDA margin has been roughly 2x Uniform earnings margin in every year since 2011, and roughly 3x Uniform earnings margin in 2004-2010, significantly distorting the market’s perception of the firm’s profitability for over a decade.
SUMMARY and United Rentals Tearsheet
As the Uniform Accounting tearsheet for Comcast Corporation (CMCS.A) highlights, Comcast Uniform P/E trades at 21.1x, near corporate average valuation levels and is in line with its own recent history.
Low P/Es require low EPS growth to sustain them, and for Comcast, the required growth to support current multiples is just -1%. Furthermore, in the case of Comcast, the company has recently shown 26% Uniform EPS growth, significantly above what is required.
Wall Street analysts provide stock and valuation recommendations that in general provide very poor guidance or insight. However, Wall Street analysts’ near-term earnings forecasts tend to have relevant information.
We take Wall Street forecasts for GAAP earnings and convert them to Uniform earnings forecasts. When we do this, Comcast’s Wall Street analyst-driven forecast is just -11% in 2019 and 7% 2020.
Based on current stock market valuations, we can back into the required earnings growth rate that would justify $44 per share. These are often referred to as market embedded expectations. In order to meet the current market valuation levels of Comcast, the company would have to have Uniform earnings grow by -1% each year over the next three years.
However, what Wall Street analysts expect for Comcast’s earnings growth falls above what the current stock market valuation requires.
To conclude, Comcast’s Uniform earnings growth is above peer averages while only trading in line with peer valuations.
Best regards,
Joel Litman & Rob Spivey
Chief Investment Strategist &
Director of Research
at Valens Research


