
Revenue estimates for the third quarter are breaking all the wrong kinds of records

Here at Valens, we always spend some time digging through the S&P 500 Index’s website every month.
The site has all kinds of useful data about the biggest companies in the U.S., making it a great resource to start our Uniform Accounting analysis. With this aggregation, it’s easy to then find any outsized trends.
Today, we are highlighting one that all of our readers should know about, and one that we warned of months ago.
Investor Essentials Daily:
The Monday Macro Report
Powered by Valens Research
Sometimes, it’s better to go to the data source rather than reinvent the wheel.
The S&P 500 site includes an earnings forecast excel sheet with a bounty of information. When we look to do our Uniform analysis of the economy as a whole, we need to look at as-reported data. From there, we know where to make adjustments to understand the risk of another recession.
The data also shows what the market is thinking about earnings growth and valuations, and we can also look at metrics like earnings beat and miss rates and analyst estimate trends.
Considering that the S&P 500 makes up the vast majority of the U.S. stock market by capitalization and a sizable chunk of the global market cap, you’d be missing important market insights if you weren’t paying attention to this data
However, there is something different about this month.
While most pundits reporting during earnings season are laser-focused on certain company earnings, we noticed a larger picture – that revenue estimates bucked a decade-long trend.
Let’s look back over the past 10 years. The quarter-on-quarter revenue growth rate has followed a standard pattern, trending up over time.
The only exception is during the first quarter of each year, which always faces a difficult comparison with the fourth quarter because the holiday season is typically the strongest revenue period for the U.S. economy.
Take a look at the quarter-on-quarter revenue growth trend.
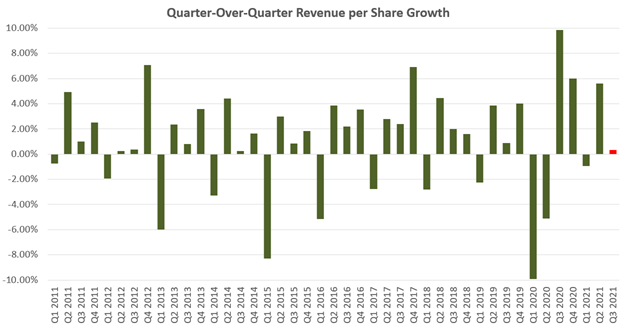
Before isolating the weak first two quarters, this third quarter doesn’t necessarily seem to be out of the ordinary.
However, once we remove the first-quarter data from the chart, this quarter’s revenue results shine through as exceptionally weak in recent years.

Third-quarter revenue growth, measured quarter over quarter for the past 10 years, typically ranges between 0.25% and 2.41%.
Until last week’s data came in, the third quarter was expected to have negative earnings growth, which hasn’t happened in more than a decade.
As quarterly results continue trickling in, it appears that revenue growth this quarter will sit at the bottom of the 10-year range, at 32 basis points. This excludes the revenue shrinkage during the second quarter of 2020 when the economy shut down to contend with the coronavirus pandemic.
Weak sales growth is a powerful signal amid the current period of positive economic growth. It highlights what we call the “growth hangover,” caused by the explosive large-cap performance from last year.
Regular Investor Essentials Daily readers shouldn’t be surprised by the lack of growth, however.
In early October, we highlighted that our Management Confidence Index had taken a sudden nosedive, suggesting that management teams had changed their bullish tune to one of concern.
Moreover, we’ve been covering the supply chain disruptions that make it more difficult than ever for companies to do business. Companies are hesitant to invest in long-term growth amid the uncertainty and their often-expensive attempts to secure short-term supply.
As of early November, third-quarter earnings are coming in slightly stronger than previously expected, causing the S&P 500 to revise its outlook higher, to the weak growth we are highlighting today.
While these weaker earnings reports do mean choppiness in the market, our message back in October hasn’t changed.
The underlying debt picture of the market is still strong, creating a solid floor on valuations. This means you shouldn’t be viewing this volatility as a signal to sell, but a buying opportunity for a market that still has legs.
Best regards,
Joel Litman & Rob Spivey
Chief Investment Strategist &
Director of Research
at Valens Research