
This discount retailer is winning the K-shaped retail recovery

Today’s company has been one of the few long-term brick and mortar winners, but it may be too late for investors to get involved.
Using our embedded expectations framework, we’ll look to see if the market is clued in on how well this company has been able to buck the retail apocalypse trend.
Also below, the company’s Uniform Accounting Performance and Valuation Tearsheet.
Investor Essentials Daily:
Thursday Tearsheets
Powered by Valens Research
The post-pandemic recovery has been unequal across the economy, with many people classifying it as a K-shaped recovery. Companies that provide value for their customers, especially online, have excelled, while the rest have been left behind.
Furthermore, the clearest examples of winners and losers have not been across different industries, but within individual markets. One example is the retail industry, where large department stores whose offerings could be easily replaced by offerings from online shops went bankrupt.
Stores like JCPenney, Neiman Marcus, and others went bankrupt during the pandemic, as they were unable to adopt the new world order of e-commerce taking over brick and mortar sales. This “retail apocalypse” means investors have written off many physical storefronts.
However, stores that deliver value, fitting unique customer needs and offerings, have been successful. A great example is Ross Stores (ROST). Its “Treasure Hunt” shopping model makes clothes shopping feel more like an adventure than a chore.
This model takes advantage of brick and mortar retail’s distinct advantage over online. Only in person can consumers go on a treasure hunt to sift through the mountain of inventory and find the best perceived deals.
The markets have taken notice of this distinct advantage, causing Ross’ stock to nearly double off of the pandemic lows.
Using our embedded expectations analysis, we can see if there’s any more room for the stock to run.
Most investors determine stock valuations using a discounted cash flow (DCF) model. A DCF model uses investors’ assumptions about the future, which then produces the “intrinsic value” of the stock.
However, here at Valens, we know models with garbage-in assumptions only come out as garbage. Therefore, we turn the DCF model on its head in the below chart. Here, we use the current stock price to solve for what returns the market expects the firm to make.
The dark blue bars represent the historical corporate performance levels, in terms of ROA. The light blue bars are Wall Street analysts’ expectations for the next two years. Finally, the white bars are the market’s expectations for how ROA will shift in the next five years.
Looking at the chart we can see Wall Street expects Uniform ROA to recover to 18% in 2022, and then further recover to 20% in 2023. After this, the market is pricing ROA to stay flat, with ROA going to 19% in 2026.
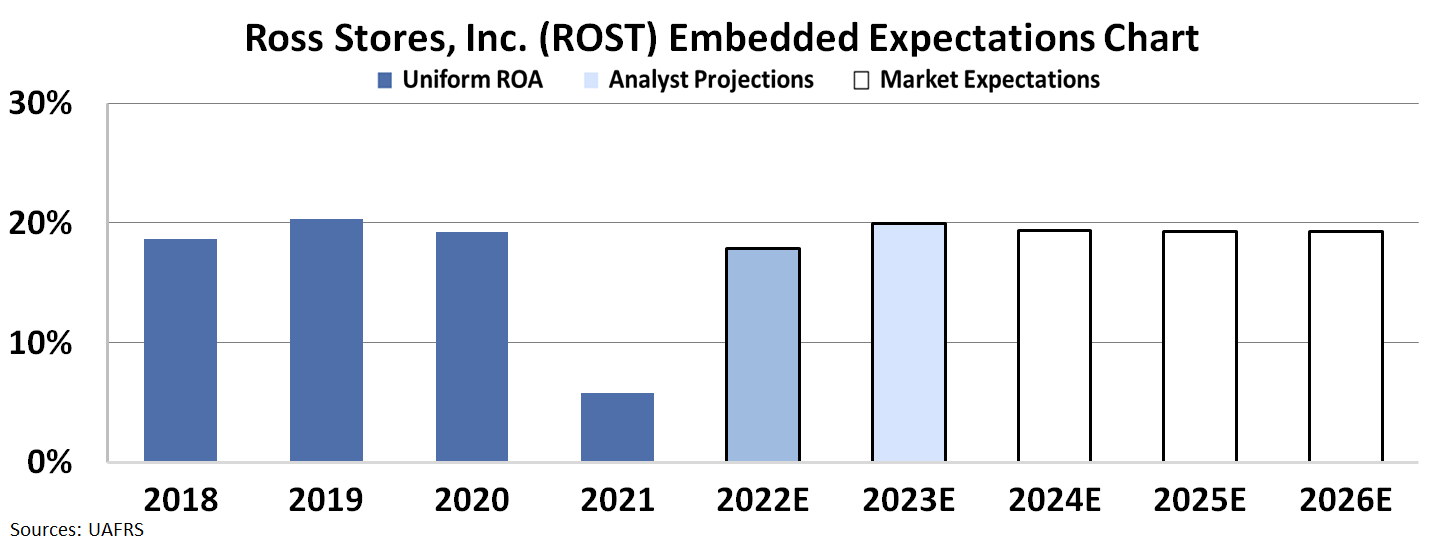
The market seems to have caught on to Ross Stores’ impressive resilience and seems to be fully valuing the company. Investors are currently pricing the company to see Uniform ROA rebound to 19%, right around its normal operating levels.
While the company’s treasure hunt business model sets it apart, the market has already clued into how Ross Stores has broken the mold of the brick and mortar retail industry model. This is a perfect example of why before trading any stock, investors need to have a firm grasp of what the market is already pricing in.
SUMMARY and Ross Stores, Inc. Tearsheet
As the Uniform Accounting tearsheet for Ross Stores, Inc. (ROST:USA) highlights, the Uniform P/E trades at 24.7x, which is around the global corporate average of 23.7x, but below its own historical average of 40.4x.
Moderate P/Es require moderate EPS growth to sustain them. That said, in the case of Ross Stores, the company has recently shown a 78% Uniform EPS decline.
Wall Street analysts provide stock and valuation recommendations that in general provide very poor guidance or insight. However, Wall Street analysts’ near-term earnings forecasts tend to have relevant information.
We take Wall Street forecasts for GAAP earnings and convert them to Uniform earnings forecasts. When we do this, Ross Stores’ Wall Street analyst-driven forecast is a 334% and 19% EPS growth in 2021 and 2022, respectively.
Based on the current stock market valuations, we can use earnings growth valuation metrics to back into the required growth rate to justify Ross Stores’ $122 stock price. These are often referred to as market embedded expectations.
The company is currently being valued as if Uniform earnings were to grow 29% annually over the next three years. What Wall Street analysts expect for Ross Stores’ earnings growth is above what the current stock market valuation requires in 2021 but below that requirement in 2022.
Furthermore, the company’s earning power in 2021 is around the long-run corporate average. However, cash flows and cash on hand are almost 6x its total obligations—including debt maturities, capex maintenance, and dividends. All in all, this signals a low credit and dividend risk.
To conclude, Ross Stores’ Uniform earnings growth is around its peer averages, while the company is trading above its average peer valuations.
Best regards,
Joel Litman & Rob Spivey
Chief Investment Strategist &
Director of Research
at Valens Research