
Uniform Accounting shows that not all franchising businesses are created equal, and this one is having more issues than investors may realize

Planet Fitness, Yum Brands, and Hilton Worldwide Holdings are great examples of franchise businesses that have grown strongly and produced phenomenal Uniform ROA.
With efforts to follow in their footsteps, this company has been growing the franchise side of its business in the recent years. One would assume that, in this space, profits will grow alongside the business growth automatically.
This misconception and misleading as-reported numbers have created the illusion of success for this company in pursuing its franchise strategy.
Also below, Uniform Accounting Embedded Expectations Analysis and the Uniform Accounting Performance and Valuation Tearsheet for the company.
Investor Essentials Daily:
Thursday Tearsheets
Powered by Valens Research
We’ve talked about the power of franchising with Marriott (MAR) and Planet Fitness (PLNT). Franchising companies can be a very compelling business if they can grow their franchise base because new revenue and new stores don’t require any incremental investment.
The issue is when you invest in franchises that have weak growth or lower-than-expected profitability. Such a case can lead to returns fading rapidly.
Take ServiceMaster Global Holdings, Inc. (SERV) as an example. It is a business that has both company-owned businesses and a large franchising core as well. Early on, the company failed to recognize the power of franchising.
ServiceMaster chose to heavily invest in their home warranty plan business American Home Shield instead of their franchise pest control business Terminix. This strategy failed to generate enough top-line growth and saw a degradation of returns.
The company has since tried to reverse course. ServiceMaster spun-off American Home Shield in 2017 and is now actively pursuing to divest the non-core ServiceMaster Brands business. This will eventually leave the firm with only its pest control business to focus solely on.
In addition, ServiceMaster spent heavily on acquisitions in the past year to bolster their pest control operations and to expand in Europe. Almost half of their total acquisitions in the past five years occurred in 2019. This included Nomor Holding AB, which is Europe’s fourth largest pest control company.
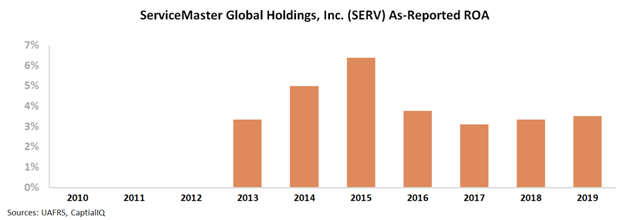
As-reported metrics are showing how ServiceMaster’s new plan is working. After dropping massively from its peak in 2015 to a historical low in 2017, as-reported ROA has slowly started to rebound. Returns appear to be accelerating as they have refocused on franchising of the pest business.
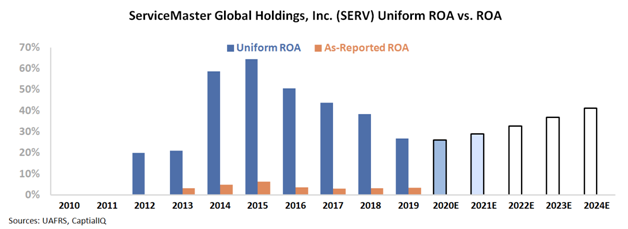
However, the real numbers show that ServiceMaster has yet to properly execute their plan. Uniform ROA has consistently declined since 2015, suggesting that the company’s strategic moves have crushed returns further.
ServiceMaster is now looking like the mirror opposite of compelling franchise companies such as Planet Fitness. However, the market continues to give the company valuations that suggest very optimistic projections around their strategy. Given no signs of recovery as of yet, current market valuations are probably unwarranted.
ServiceMaster Global Holdings, Inc. – Market expectations are for Uniform ROA to expand, but management appears concerned about damage claims, customer experience, and strategic alternatives

SERV currently trades above corporate averages relative to Uniform earnings, with a 32.9x Uniform P/E (Fwd V/E′).
At these levels, the market is pricing in expectations for Uniform ROA to improve from 27% in 2019 to 42% in 2024, accompanied by 2% Uniform asset growth going forward.
Meanwhile, analysts have less bullish expectations, projecting Uniform ROA to expand to 29% in 2021, accompanied by 17% Uniform asset shrinkage.
Historically, SERV has seen strong but volatile profitability. Following the firm’s IPO, Uniform ROA jumped from 20%-21% in 2012-2013 to a peak of 64% in 2015, before falling to 27% in 2019, as the firm struggled to integrate the acquisition of smaller pest control firms.
Meanwhile, since its 2014 IPO, SERV has seen consistent Uniform asset growth, positive in four of the past five years, while ranging from 0% to 17%.
Performance Drivers – Sales, Margins, and Turns
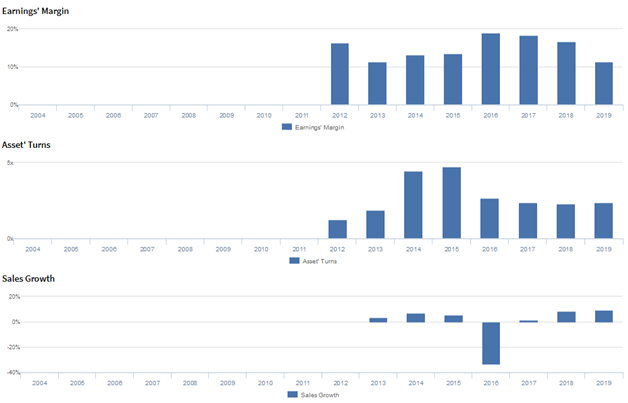
Trends in Uniform ROA have been driven primarily by trends in Uniform asset turns, and to a lesser extent, Uniform earnings margins.
Uniform asset turns expanded from 1.2x in 2012 to 4.8x in 2015, before falling to 2.3x-2.4x levels from 2017-2019.
Meanwhile, Uniform earnings margins cratered from 16% in 2012 to 11% in 2013, before improving to a high of 19% in 2016 and fading to 11% in 2019.
At current valuations, markets are pricing in expectations for both Uniform asset turns and Uniform earnings margins to recover from recent lows.
Earnings Call Forensics
Valens’ qualitative analysis of the firm’s Q4 2019 earnings call highlights that management is confident that they will generate acquisition growth of approximately $60mn carrying into 2020 and that customer experience is important to their business success.
However, management may lack confidence in their ability to sustain organic growth, identify strategic brand alternatives, and mitigate their exposure to termite damage risks, specifically in the Mobile Bay Area.
Furthermore, they may be exaggerating their focus on improving customer experience, and they may be concerned about the progress of their CEO search and margin pressures from their ongoing operational and system improvement initiatives.
Moreover, they may be downplaying concerns about higher production labor costs, increased sales commissions, and termite damage claims expenses.
Finally, they may have concerns about the launch of their customer experience platform and the threat of ongoing litigation, and they may be exaggerating the capabilities of their improved inspection tools and techniques.
UAFRS VS As-Reported
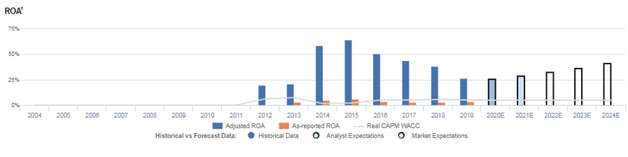
Uniform Accounting metrics also highlight a significantly different fundamental picture for SERV than as-reported metrics reflect.
As-reported metrics can lead investors to view a company to be dramatically stronger or weaker than real operating fundamentals highlight.
Understanding where these distortions occur can help explain why market expectations for the company may be divergent.
As-reported metrics significantly understate SERV’s profitability.
For example, as-reported ROA for SERV was near 4% levels in 2019, materially lower than Uniform ROA of 27%, making SERV appear to be a much weaker business than real economic metrics highlight.
Moreover, as-reported ROA has been about a tenth of Uniform ROA in each year since 2014, significantly distorting investors’ perception of the firm’s historical profitability.
SUMMARY and ServiceMaster Global Holdings, Inc. plc Tearsheet
As the Uniform Accounting tearsheet for ServiceMaster Global Holdings, Inc. (SERV) highlights, the Uniform P/E trades at 32.9x, which is above corporate average valuation levels, but around its own recent historical P/Es.
High P/Es require high EPS growth to sustain them. In the case of SERV, the company has recently shown a 20% decline in Uniform EPS.
Wall Street analysts provide stock and valuation recommendations that in general provide very poor guidance or insight. However, Wall Street analysts’ near-term earnings forecasts tend to have relevant information.
We take Wall Street forecasts for GAAP earnings and convert them to Uniform earnings forecasts. When we do this, SERV’s Wall Street analyst-driven forecast is a shrinkage of 23% in 2020, followed by a 15% growth in 2021.
Based on current stock market valuations, we can use earnings growth valuation metrics to back into the required growth rate to justify SERV’s $36 stock price. These are often referred to as market embedded expectations.
In order to justify current market expectations, SERV would need to have Uniform earnings growth of 10% each year over the next three years. What sell-side analysts expect for SERV’s earnings growth is below what the current stock market valuation requires in 2020, but is above that requirement in 2021.
Furthermore, the company’s earning power is 4x the corporate average. Also, cash flows are higher than its total obligations—including debt maturities, capex maintenance, and dividends. However, a material debt headwall in 2024 could cause concerns for debt holders. As such, the company has moderate credit risk.
To conclude, SERV’s Uniform earnings growth is below peer averages in 2019. However, the company is trading above average peer valuations.
Best regards,
Joel Litman & Rob Spivey
Chief Investment Strategist &
Director of Research
at Valens Research


