
You didn’t realize this company feeds all your pets

The spinoff of Adient was a huge deal for Johnson Controls (JCI).
Johnson Controls was a leading auto supplies company for years. They were one of the largest auto seat manufacturers. They also made car batteries.
The company had started in 1885 making temperature control systems for buildings. However over the years, their investments in the automotive space had made most focus on their automotive business.
This focus was a significant benefit for the company for most of the 1900s. The boom in autos caused a decades long bull market in the companies that supplied auto manufacturers.
However, as auto companies came more under pressure, especially in the 2000s when they came under credit pressure and GM went bankrupt in 2008, being an auto supplier became deadly for valuations.
For over a decade, the auto suppliers have all trended at P/Es that hover around 10x, with rare exceptions.
The problem for Johnson Controls was, they really weren’t an auto company. But their categorization in the auto supplier space under GICS and other industry categorization methodologies, and their significant auto supplier revenue, kept them valued like their auto supplier peers.
Since 1885, a significant amount of Johnson Controls’ revenue came from building efficiency solutions. Evolving from their early business focused on temperature control systems, a large part of Johnson Controls’ revenue has come from HVAC and other systems they sell and manage for building owners.
But as long as over 50% of Johnson Controls revenue came from its business supporting the auto OEMs (original equipment manufacturers – the auto companies), they weren’t going to be valued like the building efficiency companies, who traded at significantly higher valuations.
So in 2016, the company came up with a solution. They bought Tyco, bulking up their business overall, and then they spun off Adient. Adient contained all their auto seat business. They kept their batteries business, but by spinning off Adient, they now had significantly more revenue from the building efficiency business, including the building security business they acquired as part of Tyco.
This meant they could justify changing their industry classification from auto supplier to building products. It also was part of what led to their P/Es moving from around 10x before mid 2016 to over 17x currently.
When most people hear the name Smuckers (SJM) they think of jams and jelly. Choosy people even realize that they don’t just make ½ of a peanut butter and jelly sandwich, they make Jiff also..
Those that are exceptionally savvy realize that that isn’t even the largest part of their business. Folgers and the company’s coffee business is $2.1 billion, versus $1.76 billion for their consumer foods business.
However, both of these businesses are relatively mature businesses. Selling coffee and selling peanut butter and jelly aren’t growth businesses. This might make investors raise an eyebrow at Smuckers’ 22x as-reported P/E.
But Smuckers’ largest business isn’t in coffee or packaged food products – it’s making pet food. Smuckers owns Meow Mix, Kibbles ‘n Bits, and Milk-Bone to name a few. It’s a $2.9 billion business for them.
And the pet food business is a growing business. Spending on pet food and pets overall is a significant growth market in the US and globally. This is the type of business that justifies a 22x P/E or higher. For context, Blue Buffalo was sold to General Mills (GIS) in 2018 for almost a 40x P/E.
The most interesting thing about Smuckers might not be that it is as much a pet food company as a food company for humans. It is that Uniform Accounting highlights the company’s real P/E is 17x. The market is not pricing Smuckers like a higher growth company that it is. And not only is the company cheaper than as-reported metrics reflect, the company has strong fundamentals, and management is showing confidence about fundamental drivers that may enable them to exceed market expectations.
We’re Relaunching Our Portfolio Audit Review Offering – And Making A Special Offer
For our institutional clients, we don’t just provide access to our Valens Research app. We also do bespoke research. We produce one-off deep-dive company analyses using all our tools, including Uniform Accounting, credit work, and our management compensation and earnings call analysis. We monitor their portfolios for potential Uniform Accounting signals to alert them. We provide custom datasets for quantitative analysis, and provide aggregate analytics. We also help them create unique idea generation screens that are customized to their approach, using Uniform Accounting and our other analytics.
But for most of our institutional clients, the analysis that they find most useful, and almost universally ask for, is a quarterly portfolio audit and call with our analysts.
Our institutional clients pay a significant premium for all our bespoke research. Some of our institutional clients have paid well over $100,000 a year for our uniquely tailored Uniform Accounting research, because of the value it adds to their process.
Until Thanksgiving, we’re making a special offer.
For any investor that buys access to the Valens Research app ($10,000/year subscription), we will include an Institutional-level portfolio audit and call with our analyst team with no extra charge.
Also, for those people who sign up to the offer before end of day on November 1st, we’ll include lifetime access to all of our newsletters, including our Market Phase Cycle™ and Conviction Long Idea List (a $6,000 value), for no extra charge, for as long as you remain a Valens Research app subscriber.
We want to help show you how powerful Uniform Accounting research can be for your investment strategy.
If you want to hear more about this offer, or are interested in subscribing, feel free to reply to this email. I’ll forward your note to our head of client servicing. Or, feel free to reach out to Doug Haddad, the head of our client relations team, at doug.haddad@valens-securities.com or at 630-841-0683.
To read more about the offer and sign up, you can also click here.
Market expectations are for Uniform ROA compression, but management is confident about their positioning, brand strength, and performance

SJM currently trades below recent averages relative to UAFRS-based (Uniform) Earnings, with a 16.8x Uniform P/E. At these levels, the market is pricing in expectations for Uniform ROA to fade from 27% in 2019 to 21% by 2024, accompanied by 4% Uniform Asset growth going forward.
However, analysts have bullish expectations, projecting Uniform ROA to improve to 29% by 2021, accompanied by immaterial Uniform Asset growth.
Historically, SJM has seen robust, generally improving profitability. From 2004-2008, Uniform ROA faded from 20% to 13%, before expanding to 32% in 2010, and compressing to 25-27% levels in 2012-2014. Thereafter, Uniform ROA expanded to a peak of 39% in 2018, before compressing to 27% in 2019. Meanwhile, Uniform Asset growth has been fairly consistent, positive in 13 of the past 16 years, while ranging from -5% to 44%.
Performance Drivers – Sales, Margins, and Turns
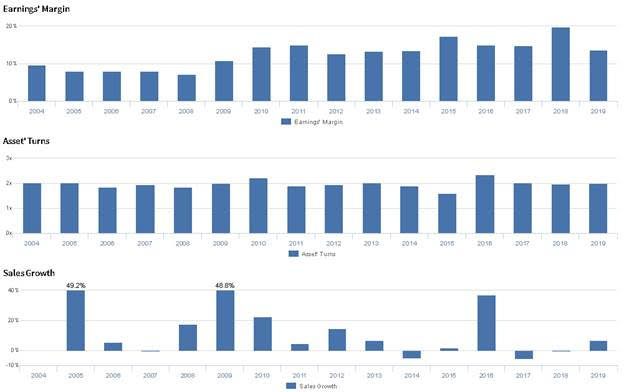
Expansion in Uniform ROA has historically been driven by trends in Uniform Earnings Margin, and to a lesser extent, Uniform Asset Turns. From 2004-2008, Uniform Margins compressed from 10% to 7%, before expanding to 15% in 2010-2011, and compressing to 13%-14% in 2012-2014. Thereafter, Uniform Margins expanded to a high in 20% to 2018, before falling to 14% in 2019. Meanwhile, after ranging from 1.9x-2.0x in 2004-2009, Uniform Turns expanded to 2.2x in 2010, before returning to 1.9x-2.0x levels in 2011-2014. Thereafter, Uniform Turns compressed to a low of 1.6x in 2015, before rising to a high of 2.3x in 2016, and fading to 2.0x levels through 2019. At current valuations, markets are pricing in expectations for compression in Uniform Margins, coupled with stability in Uniform Turns.
Earnings Call Forensics
Valens’ qualitative analysis of the firm’s Q1 2020 earnings call highlights that management is confident they are well-positioned in the high-growth snack, pet, and coffee categories, and they are confident their positioning allows them to lead pricing trends. Furthermore, they are confident they are going to see improvements in their growth brands through the remainder of the year.
However, management may lack confidence in their ability to execute on their strategic growth imperatives, and they may be concerned about further shortfalls in U.S. Retail Coffee. Furthermore, they may be concerned about the scope of their current marketing initiative, further declines in International Away From Home profit, and a continued deflationary environment in coffee and peanut butter.
UAFRS VS As-Reported
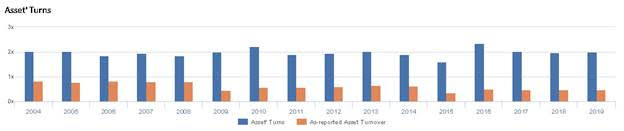
Uniform Accounting metrics also highlight a significantly different fundamental picture for SJM than as-reported metrics reflect. As-reported metrics can lead investors to view a company to be dramatically stronger or weaker than real operating fundamentals highlight. Understanding where these distortions occur can help explain why market expectations for the company may be divergent.
As-reported metrics significantly understate SJM’s asset utilization, one of the primary drivers of profitability. For example, as-reported asset turnover for SJM was 0.5x in 2019, materially lower than Uniform Turns of 2.0x, making SJM appear to be a much weaker business than real economic metrics highlight. Moreover, as-reported asset turnover has been roughly a fourth of Uniform Turns in each year since 2009, distorting the market’s perception of the firm’s asset efficiency for a decade.
Today’s Tearsheet
Today’s tearsheet is for Chevron. Chevron trades at a significant premium to market valuations. At current valuations, the market is pricing in Uniform EPS to grow, while the company is actually forecast to have EPS shrinkage the next two years. The company’s earnings growth is below peers, while the company is trading at the higher end of peer levels. Importantly, the company has risk to their dividends if they cannot improve their capital structure and obligations.
Regards,
Joel Litman
Chief Investment Strategist


