
This is the true profitability of a triple-oligopoly

Data has become a vital resource to nearly every modern industry, and the financial services industry is no exception.
Today’s company is at the center of this data, holding an oligopolistic position in three key areas of the financial services industry, giving the company strong profitability. Yet, this strength is completely missed using as-reported metrics.
Also below, the company’s Uniform Accounting Performance and Valuation Tearsheet.
Investor Essentials Daily:
Tuesday Tearsheets
Powered by Valens Research
As any Valens subscriber knows, investing in the modern world depends on having good data.
There’s a laundry list of data that investors need to make informed investment decisions. Good data allows investors to compare which companies are worth investing in and which to avoid.
Data can help identify a company’s credit health or which way the economy is going. Without data, investors would essentially be flying blind.
Therefore, financial data companies are crucial to modern investors to make quality decisions.
One of the companies at the heart of all this data is S&P Global (SPGI). It’s nearly impossible for modern investors to avoid interacting with S&P Global regularly. It maintains three separate oligopolies around crucial financial data segments.
These oligopolies have little risk of getting disrupted by new entrants due to a 104-year history, strong brand awareness, and robust market positioning.
S&P Global has an iron grip on the bond rating industry. S&P, Moody’s, and Fitch have a combined 95% market share within the space. Due to government regulations and a strong brand recognition, there’s a strong barrier to entry for any competitor.
Additionally, S&P Global has a strong position in the market intelligence space, which provides critical data for investors and financial professionals.
Finally, S&P Global also dominates the stock market indices segment, with its S&P 500 and Dow Jones Industrial Average indices.
Given these three clear oligopolies, one would assume that S&P Global would be highly profitable. On an as reported basis, S&P Global generates a healthy 20% return. While this is a solid return, it’s lower than one would expect for a firm that essentially owns three growing markets.
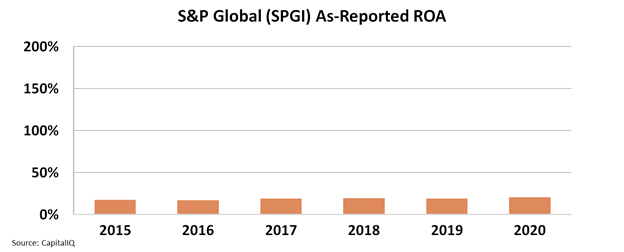
In reality, this is not an accurate picture of S&P Global’s true economic productivity.
While ROAs around 20% are solid, they are nothing compared to S&P Global’s true economic profitability. Since 2016, S&P Global’s Uniform ROA has stayed firmly above 100%, reaching 159% in 2020. These returns show the company’s true strength.
See for yourself:
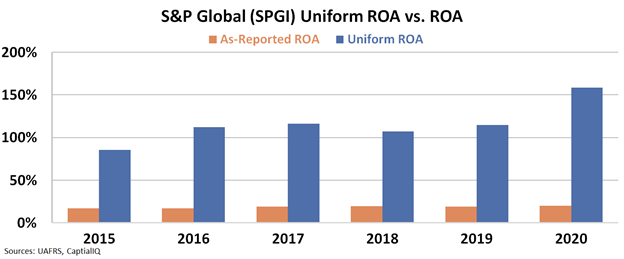
This demonstrates how dramatically as reported numbers can distort the value of a company.
Data is crucial for the modern investor, and S&P global is at the center of this data. This clear importance and strong position lead to strong profitability, which investors would completely miss if they relied on as-reported metrics.
SUMMARY and S&P Global Inc. Tearsheet
As the Uniform Accounting tearsheet for S&P Global Inc. (SPGI:USA) highlights, the Uniform P/E trades at 33.8x, which is above the global corporate average of 23.7x and its own historical average of 26.2x.
High P/Es require high EPS growth to sustain them. In the case of S&P, the company has recently shown a 27% Uniform EPS growth.
Wall Street analysts provide stock and valuation recommendations that in general provide very poor guidance or insight. However, Wall Street analysts’ near-term earnings forecasts tend to have relevant information.
We take Wall Street forecasts for GAAP earnings and convert them to Uniform earnings forecasts. When we do this, S&P’s Wall Street analyst-driven forecast is a 2% and 6% EPS growth in 2021 and 2022, respectively.
Based on the current stock market valuations, we can use earnings growth valuation metrics to back into the required growth rate to justify S&P’s $414 stock price. These are often referred to as market embedded expectations.
The company is currently being valued as if Uniform earnings were to grow by 7% annually over the next three years. What Wall Street analysts expect for S&P’s earnings growth is near what the current stock market valuation requires in 2021 and 2022.
Furthermore, the company’s earning power is 26x the long-run corporate average. Also, cash flows and cash on hand are more than 800% of its total obligations—including debt maturities, capex maintenance, and dividends. All in all, this signals a low dividend and low credit risk.
To conclude, S&P’s Uniform earnings growth is well below its peer averages, and the company is trading near its average peer valuations.
Best regards,
Joel Litman & Rob Spivey
Chief Investment Strategist &
Director of Research
at Valens Research