
This technology company is unlocking the newest commodity powering the world, and Uniform Accounting shows the value it’s created doing so

Data has become an essential part of the economy over the last few decades. Today’s company focuses on helping businesses analyze data in intuitive and easy ways.
As-reported metrics would have you believe this company’s returns are negative, but true UAFRS (Uniform) based analysis shows the firm’s real profitability.
Also below, Uniform Accounting Embedded Expectations Analysis and the Uniform Accounting Performance and Valuation Tearsheet for the company.
Investor Essentials Daily:
Tuesday Tearsheets
Powered by Valens Research
Cash has long been thought of as king, yet some say data is the new currency of the world. However, as our colleague John Sviokla has said to us many times, data is really the new oil.
While this difference may seem insignificant, it is an important one. Currency is ready to use at any point in time. If one receives cash, it can be put to work right away. This is not the case with oil or other commodities.
Oil itself is not used to fuel a car or a ship or a plane, or for its various other uses. It needs to be refined and processed, turned into gasoline, diesel, jet fuel, the inputs for things like plastic. It isn’t useful right out of the ground.
With data, the same is true. The value is not derived from the raw data itself, but from what can be done with the data once it’s cleaned up.
For example, an average employee cannot download data from a retailer’s transactions and immediately understand consumer trends. The data needs to be cleaned up and analyzed.
Similarly, as we’ve regularly highlighted with as-reported accounting data, just trying to use that data without cleaning it is pointless. The goal of Uniform Accounting is to refine as-reported financial data to make it usable and enable users to get actual conclusions.
One company that helps people refine data is Splunk (SPLK). The firm allows its customers to make sense of large data feeds in real time. It also helps companies and organizations to identify data patterns, diagnose problems, and provide intelligence to business operations.
One may assume a firm offering such an important solution would be profitable, especially given 91 of the Fortune 100 companies are partnered with Splunk.
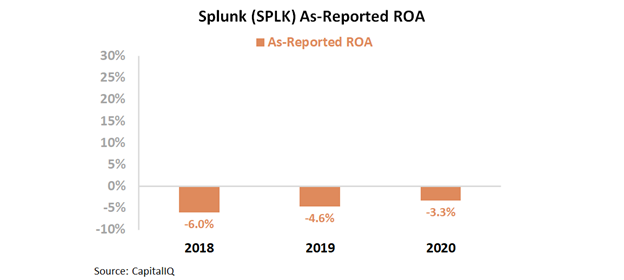
However, it appears Splunk has not been profitable according to as-reported metrics. Although it has improved over the previous three years, as-reported return on assets (ROA) was still -3% in 2020.
However, this picture of Splunk’s performance is not accurate. Profitability metrics are being distorted by bad data. GAAP’s treatment of goodwill and intangibles, among other distortions, are suppressing profitability metrics.
In reality, Splunk’s Uniform ROA has been robust. It has stayed above corporate averages over the past three years, with 17% returns in 2020.

The correct data is able to show Splunk is more successful than the market thinks. However, to fully understand the stock, future expectations must be taken into account. To evaluate the market’s assumptions for the firm, we can use the Embedded Expectations Framework.
The chart below explains the company’s historical corporate performance levels, in terms of ROA (dark blue bars) versus what sell-side analysts think the company is going to do in the next two years (light blue bars) and what the market is pricing in at current valuations (white bars).
The graph below shows sell-side analysts see major headwinds in 2021 and 2022 as Splunk alters its business model. The firm is in the process of switching from a software licensing model to a cloud-based subscription model.
This switch is going to create more costs and more customer churn in the short-run, as some customers aren’t interested in switching to a subscription model, and the company has to invest in technology, infrastructure, and its salesforce. But if companies like Adobe are any example, it is likely to aid Splunk in the long-run.
Looking past 2022, the market is expecting Uniform ROA to decline slightly to 14% in 2025. 15% is the same as Splunk’s 2017 levels. Considering the drop in profitability forecast for the next 2 years, this may seem unreasonable, however knowing how this business model, when executed successfully, eventually leads to significant ROA expansion, as was the case for Adobe, 14% returns may be well within the firm’s grasp.

Splunk highlights how important it is to look at the right data. It is vital to analyze data with the correct system in place, which is exactly what Splunk offers.
The same is true with financial data. Uniform Accounting provides investors with the correct insights. In Splunk’s case, it shows the firm has positive ROA levels, not negative returns.
Without Uniform Accounting, investors might miss a company empowering companies to refine the newest global commodity.
Splunk Inc. Embedded Expectations Analysis – Market expectations are for Uniform ROA to shrink, and management may be concerned about growth opportunities, their sales team, and financial results
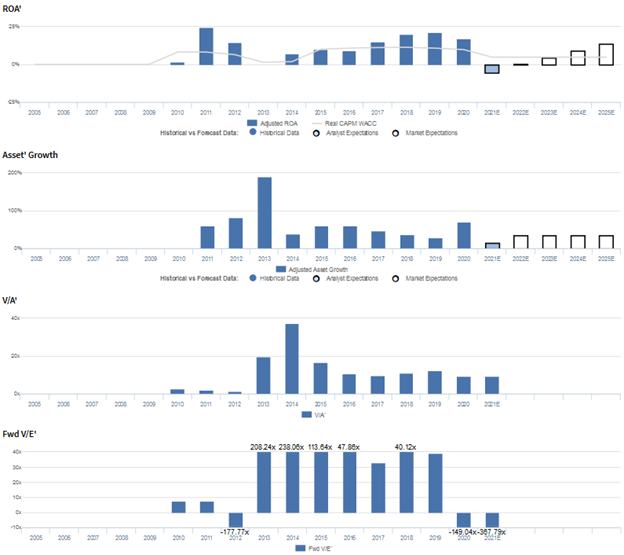
SPLK currently trades near recent averages relative to Uniform assets, with a 9.2x Uniform P/B (V/A’). At these levels, the market is pricing in expectations for Uniform ROA to shrink from 17% in 2020 to 14% in 2025, accompanied by 36% Uniform asset growth going forward.
Meanwhile, analysts have even more bearish expectations, projecting Uniform ROA to only rebound to immaterial levels in 2022 after falling to -5% next year, accompanied by 16% Uniform asset growth.
SPLK has historically seen generally robust, yet volatile profitability. After jumping from 2% in 2010 to 24% in 2011, Uniform ROA shrunk to immaterially negative levels in 2013 following its IPO. Uniform ROA gradually recovered to 21% in 2019 before fading to 17% in 2020.
Meanwhile, as an asset-light firm, Uniform asset growth has been robust and positive each year since 2011, while ranging from 29%-82%, excluding 190% growth in 2013 resulting from its IPO.
Performance Drivers – Sales, Margins, and Turns
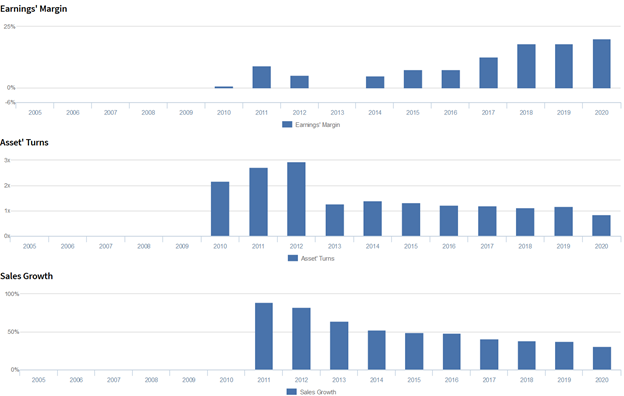
Trends in Uniform ROA have been driven primarily by improvements in Uniform earnings margins, slightly offset by declines in Uniform asset turns.
Uniform margins rose from 1% in 2010 to 9% in 2011, before regressing to immaterially negative levels in 2013, and subsequently rebounding to a peak of 20% in 2020.
Meanwhile, after expanding from 2.2x in 2010 to 2.9x in 2012, Uniform turns fell to 1.3x-1.4x levels in 2013-2015, before contracting further to a low of 0.9x in 2020.
At current valuations, markets are pricing in expectations for Uniform margins to reverse recent gains and for Uniform turns to continue to decline.
Earnings Call Forensics
Valens’ qualitative analysis of the firm’s Q1 2021 earnings call highlights that management is confident in the shift to the cloud in countries where they already have customers.
However, they may lack confidence in the sustainability of RPO bookings growth and the potential of their Workload Migration Program with AWS.
They may also lack confidence in their ability to predict customer demand, and their enterprise sales team’s ability to complete deals.
Moreover, they may be exaggerating the critical nature of Splunk for their customers and the benefits of on-prem to cloud transition services.
Furthermore, they may lack confidence in the effectiveness of their Omnition control framework and may be exaggerating the growth in demand for data.
Finally, they may be exaggerating the tools available to their sales team to secure customers and may have concerns about continued margin weakness, as well as their ability to generate expected cash yields.
UAFRS VS As-Reported
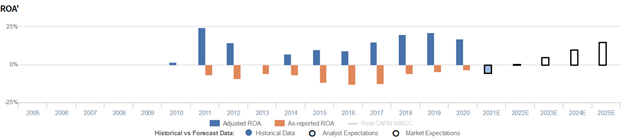
Uniform Accounting metrics also highlight a significantly different fundamental picture for SPLK than as-reported metrics reflect.
As-reported metrics can lead investors to view a company to be dramatically stronger or weaker than real operating fundamentals highlight. Understanding where these distortions occur can help explain why market expectations for the company may be divergent.
As-reported metrics significantly understate SPLK’s profitability. For example, as-reported ROA for SPLK was -3% in 2020, far lower than Uniform ROA of 17%, making SPLK appear to be a much weaker business than real economic metrics highlight.
Moreover, since 2014, as-reported ROA has been negative in each year, while Uniform ROA has been positive in each year over the same timeframe, materially distorting the market’s perception of the firm’s profitability ceiling.
SUMMARY and Splunk Inc. Tearsheet
As the Uniform Accounting tearsheet for Splunk Inc (SPLK:USA) highlights, its Uniform P/E trades at -367.8x, which is below global corporate average valuation levels and its historical average valuations.
Low P/Es require low EPS growth to sustain them. In the case of Splunk, the company has recently shown a 29% Uniform EPS growth.
Wall Street analysts provide stock and valuation recommendations that in general provide very poor guidance or insight. However, Wall Street analysts’ near-term earnings forecasts tend to have relevant information.
We take Wall Street forecasts for GAAP earnings and convert them to Uniform earnings forecasts. When we do this, Splunk’s Wall Street analyst-driven forecast an EPS decline of 168% and a lower decline of 68% in 2021 and 2022, respectively.
Based on the current stock market valuations, we can use earnings growth valuation metrics to back into the required growth rate to justify Splunk’s $175 stock price. These are often referred to as market embedded expectations.
The company needs to have Uniform earnings grow by 34% each year over the next three years to justify current prices. What Wall Street analysts expect for Splunk’s earnings growth is below what the current stock market valuation requires in 2021 and 2022.
Furthermore, the company’s earning power is 3x the corporate average. Also, cash flows are 2x higher than its total obligations—including debt maturities and capex maintenance. Together, this signals low credit and dividend risk.
To conclude, Splunk’s Uniform earnings growth is below peer averages. Therefore, as is warranted, the company is also trading below peer values.
Best regards,
Joel Litman & Rob Spivey
Chief Investment Strategist &
Director of Research
at Valens Research


