
Sports betting is legal… which companies are best poised for it?

Since a landmark Supreme Court decision in 2018, sports betting has become legal in many states across the United States.
As states begin to introduce legislation to welcome sports betting and online gambling companies, Roundhill Sports Betting & iGaming ETF (BETZ) has become a popular way for investors to get a piece of the profits states and companies are reaping.
To better understand why Roundhill’s BETZ ETF has become so popular among retail investors, let’s use Uniform Accounting to analyze the largest holdings in their portfolio and answer a simple question – which sports betting and iGaming firms are best poised for future growth?
Also below, a detailed Uniform Accounting tearsheet of the fund’s largest holdings.
Investor Essentials Daily:
Friday Uniform Portfolio Analytics
Powered by Valens Research
From gladiator fights in Ancient Rome to blackjack in Las Vegas, competition and wagering on the outcome is one of the world’s oldest professions.
In recent decades, gambling has transformed a lot, but only as much as laws have allowed. As consumer trends evolved from going to casinos to online, sports gambling remained illegal. This served as a huge roadblock, forcing the market into grey or black market channels.
2018 was a watershed year for the industry. The Supreme Court made the ruling to let individual states determine the legality of sports betting.
The total gambling market held a value of $43.6 billion in 2019, with growth beating U.S. GDP growth at 4%.
With legalization on the forefront, 30 states have already taken advantage of making sports betting legal. More importantly, however, online casinos and sports betting have seen huge spikes in demand as customers pivot to placing game-day bets on their phones.
Some studies estimated that before 2018, U.S. gamblers illegally wagered $150 billion to $380 billion per year on sports bets.
These estimates may cross some as an exaggeration, however, even conservative estimates peg the market at $50 billion.
While many states have already taken advantage of this decision, and the influx of cash associated with legalization, other states continue to follow. The most recent convert is New York, becoming the 18th state in the US to legalize online sports betting earlier this month.
The immense opportunity and growth drivers present for states are shared by two industries in particular. The gambling industry and the tech stack that stands behind it.
Rapid yet sporadic adoption of sports betting in different states has made it a struggle to identify which companies will be winners and losers.
In New York, for example, four companies were approved for gambling, but all other platforms were excluded. In other states, different regulations have also created challenges in figuring out which players will come out on top.
Regardless of which companies do end up on top, the industry as a whole is poised for success. This is why investors are excited to put their money with the Roundhill Sports Betting & iGaming ETF (BETZ), as it is exposed to the entire trend.
Let’s take a look at BETZ under the Uniform Accounting lens to see if some of the biggest names in the index are compelling investments. This will help us understand growth expectations for some of the largest companies in the portfolio.
The goal of BETZ is to get exposure to the entirety of the booming sports betting industry.
With investments like Draftkings (DKNG) and Penn National Gaming (PENN), the parent company of Barstool Sports, among other legacy gambling institutions like MGM Resorts (MGM) and Caesar Entertainment (CZR), the ETF has exposure to a wide range of companies in the sector.
To some, it has become challenging to understand which companies are best poised to succeed in this unsteady sports betting legalization process.
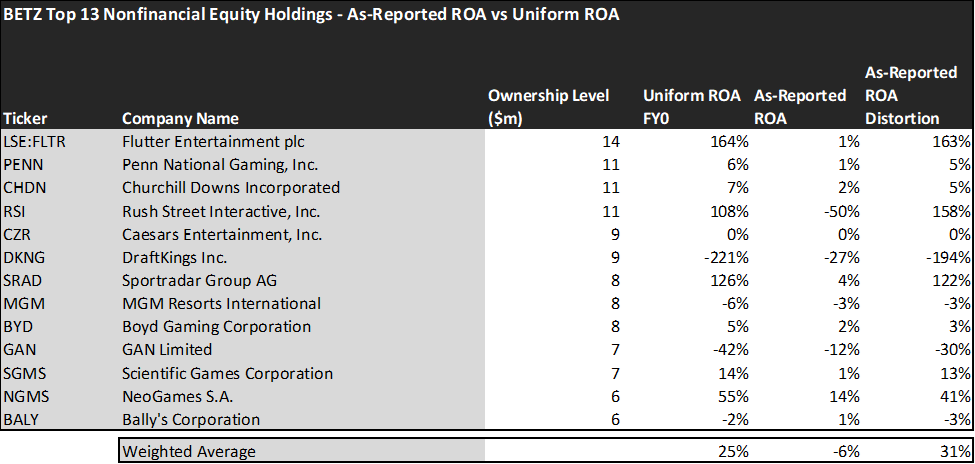
Economic productivity is massively misunderstood on Wall Street. This is reflected by the 130+ distortions in the Generally Accepted Accounting Principles (GAAP) that make as-reported results poor representations of real economic productivity.
These distortions include the poor capitalization of R&D, the use of goodwill and intangibles to inflate a company’s asset base, a poor understanding of one-off expense line items, and flawed acquisition accounting.
It is no surprise that once many of these distortions are accounted for, it becomes apparent which companies are in reality robustly profitable and which may not be as strong of an investment.
The average as-reported ROA among BETZ’s top 13 names is a concerning -6%, which implies to investors that these companies are in fact destroying economic value for their investors. In reality, these companies perform far better, with a 25% Uniform ROA.
Rush Street Interactive (RSI), for example, doesn’t return -50%. It actually boasts a 108% Uniform ROA, way above what the average for this sector is.
Similarly, Sportsrader Group (SRAD) does not have 4% returns. As a smaller firm with a higher level of productivity, it also has a 126% Uniform ROA.
These dislocations demonstrate that some sports betting companies are in a better financial position than GAAP may make their books appear. But there is another crucial step in the search for alpha. Investors need to also find companies that are performing better than their valuations imply.
Valens has built a systematic process called Embedded Expectations Analysis to help investors get a sense of the future performance already baked into a company’s current stock price. Take a look:
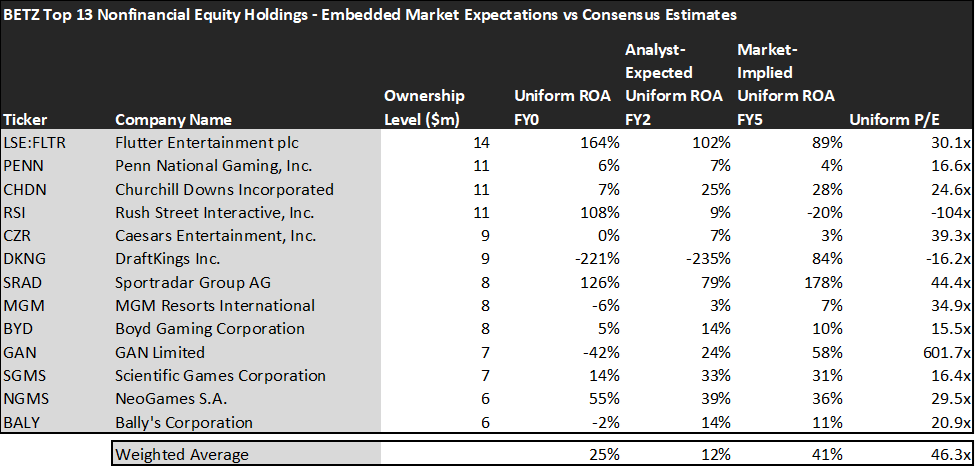
This chart shows four interesting data points:
- The Uniform ROA FY0 represents the company’s current return on assets, which is a crucial benchmark for contextualizing expectations.
- The analyst-expected Uniform ROA represents what ROA is forecast to be over the next two years. To get the ROA number, we take consensus Wall Street estimates and we convert them to the Uniform Accounting framework.
- The market-implied Uniform ROA is what the market thinks Uniform ROA is going to be in the three years following the analyst expectations, which for most companies here is 2023, 2024, and 2025. Here, we show the sort of economic productivity a company needs to achieve to justify its current stock price.
- The Uniform P/E is our measure of how expensive a company is relative to its Uniform earnings. For reference, average Uniform P/E across the investing universe is roughly 24x.
Embedded Expectations Analysis of BETZ paints a clear picture of the ETF. The stocks it tracks are expensive.
While analysts expected average ROA to decrease from 25% to 12%, the market is pricing these companies to grow their economic profitability to 41%.
A company like DraftKings (DKNG) that has already struggled in recent quarters to perform up to market pricing, may struggle to reach a lofty 84% ROA compared to analyst expectations of -235%.
Bullish expectations on companies like DraftKings create situations where investors may find themselves disappointed.
This just goes to show the importance of valuation in the investing process. Finding high growth and quality firms is only half of the process. The other, just as important part, is attaching reasonable valuations to the companies.
To see a list of companies that have great performance and innovation also at attractive valuations, the Valens Conviction Long List is the place to look. The conviction list is powered by the Valens database, which offers access to full Uniform Accounting metrics for thousands of companies.
Click here to get access.
Read on to see a detailed tearsheet of the largest holding in BETZ.
SUMMARY and Flutter Entertainment plc Tearsheet
As BETZ’s largest individual stock holdings, we’re highlighting Flutter Entertainment plc’s tearsheet today.
As the Uniform Accounting tearsheet for Flutter Entertainment plc (FLTR:GBR) highlights, its Uniform P/E trades at 30.1x, which is above the global corporate average of 24.0x and its own historical average of 21.2x.
High P/Es require high EPS growth to sustain them. In the case of Flutter, the company has recently shown a 44% Uniform EPS growth.
Wall Street analysts provide stock and valuation recommendations that, in general, provide very poor guidance or insight. However, Wall Street analysts’ near-term earnings forecasts tend to have relevant information.
We take Wall Street forecasts for GAAP earnings and convert them to Uniform earnings forecasts. When we do this, Flutter’s Wall Street analyst-driven forecast is for EPS to decline by 40% in 2021 and grow 65% in 2022.
Based on the current stock market valuations, we can use earnings growth valuation metrics to back into the required growth rate to justify Flutter’s GBP 108 stock price. These are often referred to as market embedded expectations.
The company is currently being valued as if Uniform earnings were to grow 5% annually over the next three years. What Wall Street analysts expect for Flutter’s earnings growth is below what the current stock market valuation requires in 2021, but above that requirement in 2022.
Meanwhile, the company’s earning power is well above the long-run corporate averages. Furthermore, cash flows and cash on hand are around 2x total obligations—including debt maturities, capex maintenance, and dividends. This signals low credit and operating risks.
Lastly, Flutter’s Uniform earnings growth is below peer averages, but the company is trading above its average peer valuations.
Best regards,
Joel Litman & Rob Spivey
Chief Investment Strategist &
Director of Research
at Valens Research