
This fund won its manager several awards – Let’s look under the hood

We at Valens work hard to cut through distorted as-reported accounting to deliver stock recommendations based on real economic conditions.
Today, we will examine a fund that thinks about investing similarly, and has even won its manager Jeffrey Madden several awards for 2020. By examining this fund’s make-up, we could better understand what makes the strategy work.
In addition to examining the portfolio, we’re including a deeper look into one of the fund’s largest current holdings, providing you with the current Uniform Accounting Performance and Valuation Tearsheet for that company.
Investor Essentials Daily:
Friday Uniform Portfolio Analytics
Powered by Valens Research
In a few different interviews, Joel has talked about Bart Madden, who we sometimes refer to as the godfather of adjusted accounting analytics. He pioneered much of how we at Valens think about company financials.
Bart Madden’s 2020 book “Value Creation Principles” is the latest in a series that discusses what he calls the “competitive life-cycle framework.”
The basic idea is that companies typically find themselves in one of four stages of their life. The red line represents the economic return of a business, the green line shows the degree to which the firm reinvests its cash flows, and the blue line is the cost of capital.
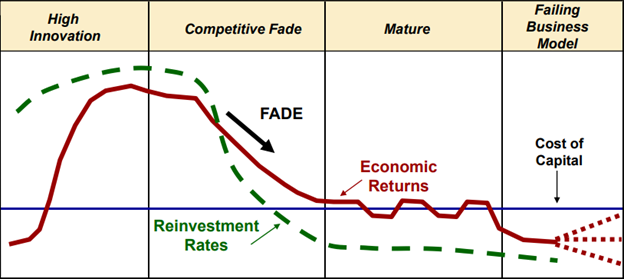
Bart Madden’s thesis is that understanding the intricacies of the competitive life cycle, in tandem with an awareness of the problems with as-reported accounting, facilitates a far stronger understanding of value creation in general.
While Bart has since stepped away from investment management and now pursues financial research and philanthropy, his son and friend of the firm Jeff has kept the legacy going.
Jeff Madden, named 2020 small/mid cap manager of the year by Envestnet and Investment Advisor Magazine, manages the SMID Cap Fund at RMB Capital.
Similar to how we here at Valens pick the firms on our Conviction Long List, Jeff selects companies based on their true economic return rather than their as-reported financials.
This process involves a ground-up re-interpretation of the financial statements in a manner that is consistent across the board, which allows for true apples-to-apples comparisons between firms. RMB calls it the Economic Return framework, while we call it Uniform Accounting. Different names, but similar ideas.
Then, Jeff looks for companies that allocate capital appropriately given their life cycle stage. This is crucial because a company’s path to wealth creation can differ tremendously given its position in the life cycle.
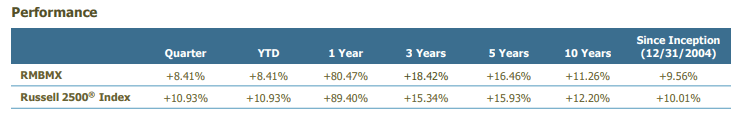
The SMID Cap fund (RMBMX), through SMB’s strategy, has outperformed its benchmark, the Russel 2500, for the past several years.
We’ve conducted a portfolio audit of RMBMX’s top holdings to get a better look under the hood.
The following are the top nine RMBMX holdings for which our team has made Uniform accounting adjustments. These metrics highlight that Jeff’s team has chosen companies that are far more economically productive than most would realize.
See for yourself below.
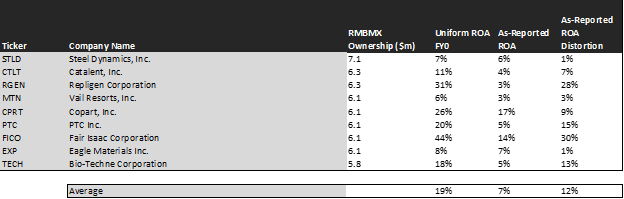
When weighted equally among these names, we can see that the average as-reported ROA is a mere 7%, barely higher than the cost of capital. Real economic metrics show a completely different picture: a true economic return of 19%, almost three times the as-reported average.
Let’s look at one prime example among RMBMX’s top holdings: Repligen Corporation (RGEN). If you took its as-reported financials at face value, you’d see an awful firm returning well below the cost of capital.
In reality, Repligen is a strong company with margins that have been steadily increasing over the past decade as many drug developers have become reliant on its technology. Hence, this firm’s Uniform ROA isn’t 3%, but 31%.
Fair Isaac Corporation (FICO), the practitioner of the FICO credit score, is another great example. Its as-reported ROA is already a respectable 14%, but the reality is that this firm has not just good, but exceptional economic productivity, with a Uniform ROA of 44%.
Moreover, not a single firm on this list has economic performance overstated by as-reported financials. This is a rarity among funds, and goes to show that Jeff Madden’s team has done their homework.
By getting a clearer picture of real economic profitability, equity researchers can easily find cases where the market is under-pricing them.
This is the key to generating wealth through investing because it maximizes the probability that the market discovers a company’s true worth, causing a massive appreciation in stock price.
RMBMX clearly has this in mind as well. Take a look:
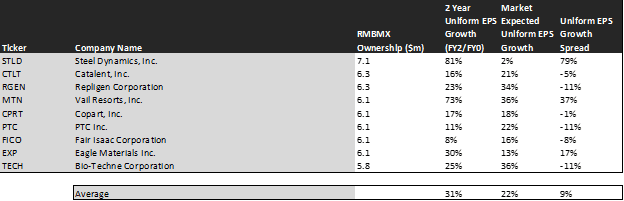
This chart shows three interesting data points:
– The first datapoint is what Uniform earnings growth is forecast to be over the next two years, when we take consensus Wall Street estimates and we convert them to the Uniform Accounting framework. This represents the Uniform earnings growth the company is likely to have, the next two years.
– The second datapoint is what the market thinks Uniform earnings growth is going to be for the next two years. Here, we are showing how much the company needs to grow Uniform earnings in the next 2 years to justify the current stock price of the company. If you’ve been reading our daily and our reports for a while, you’ll be familiar with the term embedded expectations. This is the market’s embedded expectations for Uniform earnings growth.
– The final datapoint is the spread between how much the company’s Uniform earnings could grow if the Uniform Accounting adjusted earnings estimates are right, and what the market expects Uniform earnings growth to be.
The market expects this portfolio to grow 22% over the next two years, whereas analysts expect it to grow 31%, a spread of 9%. This is impressive for a multisector, diversified portfolio.
Steel Dynamics (STLD), the fund’s largest holding, is expected to essentially maintain its current EPS results for the next two years to justify its current valuation. Analysts who work every day to forecast sales, growth, and business conditions think earnings will nearly double. These are ripe conditions for an EPS surprise that sends the stock surging higher.
Vail Resorts (MTN) is another great example of mispriced growth potential. The market is expecting MTN to improve its earnings by 36% over the next two years. Analysts, however, think it will grow by 73% as the mountain sports industry continues to consolidate under the Vail umbrella.
Across these securities, there is a nearly 10% dislocation between market and analyst expectations that is favorable to RMBMX.
As you can see, Bart Madden’s legacy lives on with his son and fund, as evidenced by their ability to cut through the accounting noise to pick companies with fundamental upside.
Steel Dynamics, Inc. Tearsheet
As RMB SMID Cap’s largest individual stock holding, we’re also highlighting the tearsheet of Steel Dynamics today.
As our Uniform Accounting tearsheet for Steel Dynamics, Inc. (STLD:USA) highlights, its Uniform P/E trades at 6.0x, which is below the global corporate average valuation of 23.7x and its own historical valuation of 9.8x.
Low P/Es require low EPS growth to sustain them. In the case of Steel Dynamics, the company recently had a 19% Uniform EPS decline.
While Wall Street stock recommendations and valuations poorly track reality, Wall Street analysts have a strong grasp on near-term financial forecasts like revenue and earnings.
As such, we use Wall Street GAAP earnings estimates as a starting point for our Uniform earnings forecasts. When we do this, we can see that Steel Dynamics is forecast to see a Uniform EPS growth of 535% in 2021 and a decline of 48% in 2022.
The company’s earnings power is in line with the corporate averages. However, cash flows and cash on hand is 5x the current obligations, indicating a low credit risk.
To conclude, Steel Dynamics’s Uniform earnings growth is well above peer averages, but is trading below peer valuations.
Best regards,
Joel Litman & Rob Spivey
Chief Investment Strategist &
Director of Research
at Valens Research