Uniform Accounting shows why having a longer-term view of R&D investment should warn investors off this chip stock

Research and Development (R&D) is an investment that often has no tangible or recoverable value if it fails. As such, overspending on R&D can spook investors looking to see favorable returns.
At first glance, this firm looks like it has been unfairly judged by the market, with declines in profitability attributable to potentially transitory macro issues.
Upon further examination, when using Uniform Accounting, it becomes apparent that investors are justified in being wary of this firm and its lack of recent R&D success.
Also below, Uniform Accounting Embedded Expectations Analysis and the Uniform Accounting Performance and Valuation Tearsheet for the company.
Investor Essentials Daily:
Thursday Tearsheets
Powered by Valens Research
Investors can get worried about overinvestment, particularly in R&D. Unlike spending on plants or equipment, if a company invests in R&D, and that investment fails, there is nothing tangible to sell to recoup losses. It is possible there is some value in those investments, but it can make investors wary.
This is especially true in the semiconductor space, a highly competitive industry dependent on technological advances. Overinvestment in R&D can be a major headwind for a company.
We talked about this exact scenario with Advanced Micro Devices (AMD) in the past.
Investors hated AMD for a long time for this exact reason. The firm had significantly overinvested in R&D and was bleeding money as a result.
The stock toiled at low levels for years until Lisa Su took over as CEO and focused on reining in that excess spend. Once she was able to convince investors the firm was no longer overspending, and no longer a credit risk as a result, shares took off.
Similarly, Skyworks Solutions (SWKS) has invested massively in recent years. Since 2015, the firm has spent $1.8bn in R&D alone, not to mention another several billion spent on property and plants, and acquisitions.
The firm has invested to try to get to the forefront of a variety of new markets, spanning from automotive and home automation, to the 5G revolution.
Meanwhile, it appears the firm has been able to sustain profitability, or at least had been, prior to 2019.
From 2010 through 2015, the company invested and rolled up other smaller companies within its markets, and eventually drove return on assets (ROA) to peak levels. Even with recent investments in R&D, Skyworks was able to maintain returns near those peaks, at least until 2019 when it faced headwinds related to Huawei sanctions.
Assuming US-China trade talks eventually moderate, and Skyworks’s operations can resume at a more normal level, ROA would be expected to rebound. Shares of the company have been roughly sideways over the last few years, so might this offer a buying opportunity?
After all, the company was able to invest massively and keep returns stable, unlike some of its peers that overinvest. It would appear returns only fell due to issues with Huawei. So, once those issues are lifted, the subsequent rebound in returns should mean good things for the stock.
At least that is how the firm’s profitability trends initially appear.
But that initial glance is missing the mark fairly significantly.
When the adjustments under Uniform Accounting are applied, adjustments like capitalizing R&D, and moving it to the balance sheet, it is clear Skyworks’s problems originated much earlier than last year.
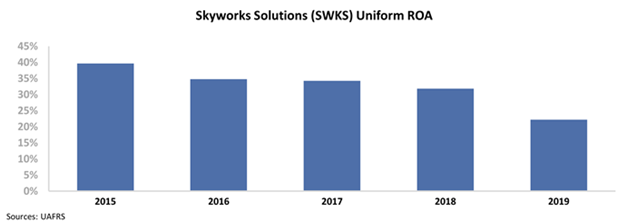
In fact, Skyworks has seen Uniform ROA decline consistently each year since 2015. Because its been having the same over-investment issues that investors used to dislike AMD for.
Once those adjustments are made, it’s clear this wasn’t a one-off issue. This is a company that has seen profitability decline consistently. As a result, those investors thinking they are getting a value stock bound for a rebound might actually be getting a value trap.
Market expectations are for Uniform ROA compression, and management may be concerned about their positioning, growth, and 5G
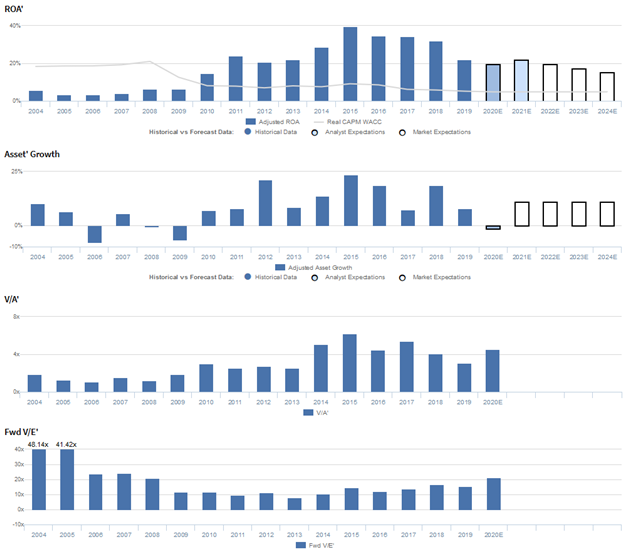
SWKS currently trades below recent averages relative to Uniform earnings, with a 21.3x Uniform P/E (Fwd V/E’). At these levels, the market is pricing in expectations for Uniform ROA to fall from 22% in 2019 to 16% in 2023, accompanied by 10% Uniform asset growth.
Meanwhile, analysts have somewhat less bearish expectations, projecting Uniform ROA to remain at 22% levels through 2021, accompanied by 1% Uniform asset shrinkage.
Historically, SWKS has seen generally improving profitability. After sitting at muted 3%-6% levels from 2004-2009, Uniform ROA expanded to 24% in 2011, before fading to 21%-22% levels in 2012-2013, and rising to a peak of 40% in 2015. However, since then, Uniform ROA has compressed to 22% in 2019.
Meanwhile, Uniform asset growth has been fairly consistent, positive in 13 of the past 16 years, while ranging from -8% to 24%.
Performance Drivers – Sales, Margins, and Turns
Improvements in Uniform ROA have been driven primarily by trends in Uniform margins, and to a lesser extent, Uniform turns.
After ranging from 5%-9% from 2004-2009, Uniform margins expanded to peak 31%-33% levels from 2016-2018, before fading to 29% in 2019.
Meanwhile, Uniform turns expanded from 0.6x-0.8x levels from 2004-2009 to 1.3x in 2015, before compressing to 0.8x in 2019.
At current valuations, markets are pricing in expectations for further compression in both Uniform margins and Uniform turns.
Earnings Call Forensics
Valens’ qualitative analysis of the firm’s Q1 2020 earnings call highlights that management is confident that their recent large client wins represent companies that were not possibilities a few years ago and that they are focused on driving a 30% free cash flow margin.
However, they may be exaggerating the strength of their positioning among large clients in the automotive and phone manufacturing industries, the potential of their low-band and 4G opportunities, and their ability to meet 5G ramp-up needs.
Moreover, they may lack confidence in their ability to develop best-in-class solutions and create devices that go into 5G-enabled phones.
Finally, they may be concerned about seasonality and the sustainability of broad market business growth.
UAFRS VS As-Reported
Uniform Accounting metrics also highlight a significantly different fundamental picture for SWKS than as-reported metrics reflect.
As-reported metrics can lead investors to view a company to be dramatically stronger or weaker than real operating fundamentals highlight.
Understanding where these distortions occur can help explain why market expectations for the company may be divergent.
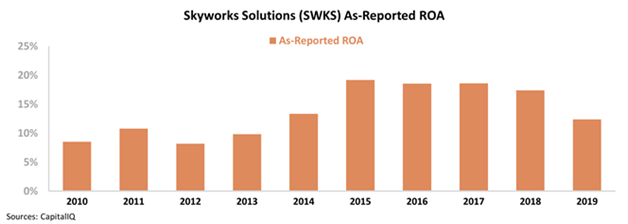
As-reported metrics significantly understate SWKS’s profitability.
For example, as-reported ROA for SWKS was 12% in 2019, materially lower than Uniform ROA of 22%, making SWKS appear to be a much weaker business than real economic metrics highlight.
Moreover, as-reported ROA has been nearly half of Uniform ROA in each year since 2011, distorting the market’s perception of the firm’s profitability for almost a decade.
SUMMARY and Skyworks Solutions, Inc. Tearsheet
As the Uniform Accounting tearsheet for Skyworks (SWKS) highlights, the Uniform P/E trades at 21.3x, which is around corporate average valuation levels, but above its own recent history.
Average P/Es require average EPS growth to sustain them. In the case of Skyworks, the company has recently shown a 21% Uniform EPS shrinkage.
Wall Street analysts provide stock and valuation recommendations that in general provide very poor guidance or insight. However, Wall Street analysts’ near-term earnings forecasts tend to have relevant information.
We take Wall Street forecasts for GAAP earnings and convert them to Uniform earnings forecasts. When we do this, Skyworks’ Wall Street analyst-driven forecast is a 9% EPS shrinkage in 2020 and a rebound to an 18% growth in 2021.
Based on current stock market valuations, we can use earnings growth valuation metrics to back into the required growth rate to justify Skyworks’ $119 stock price. These are often referred to as market embedded expectations.
The company can have Uniform earnings grow by 1% each year over the next three years and still justify current prices. What Wall Street analysts expect for Skyworks’ earnings growth is above what the current stock market valuation requires in 2021.
Meanwhile, the company’s earning power is 4x the corporate average. Also, cash flows are significantly higher than its total obligations—including debt maturities, capex maintenance, and dividends. Together, this signals low credit and dividend risk.
To conclude, Skyworks’ Uniform earnings growth is below peer averages currently, and the company is trading below average peer valuations.
Best regards,
Joel Litman & Rob Spivey
Chief Investment Strategist &
Director of Research
at Valens Research


