A hip, a hip, my country for a hip

Most clinicians would agree that a hip fracture is one of the most concerning injuries an elderly person can sustain. While many might think of it as just a broken bone, like any others, the mortality rate for the elderly when they sustain a broken hip is as high as 58% according to some studies.
A major cause of high mortality rates is what clinicians call “cascading failures” – as patients become immobile after a hip break, other maladies become larger problems. As such, a big focus is to get patients healthy and mobile as soon as possible. An obvious option to help get people mobile sooner rather than later is to replace the broken hip.
As the US and global population age, the demand for hip replacements, and many other orthopaedic replacements is only continuing to increase.
The three largest players in the hip replacement market are Zimmer Biomet, JNJ, and Stryker.
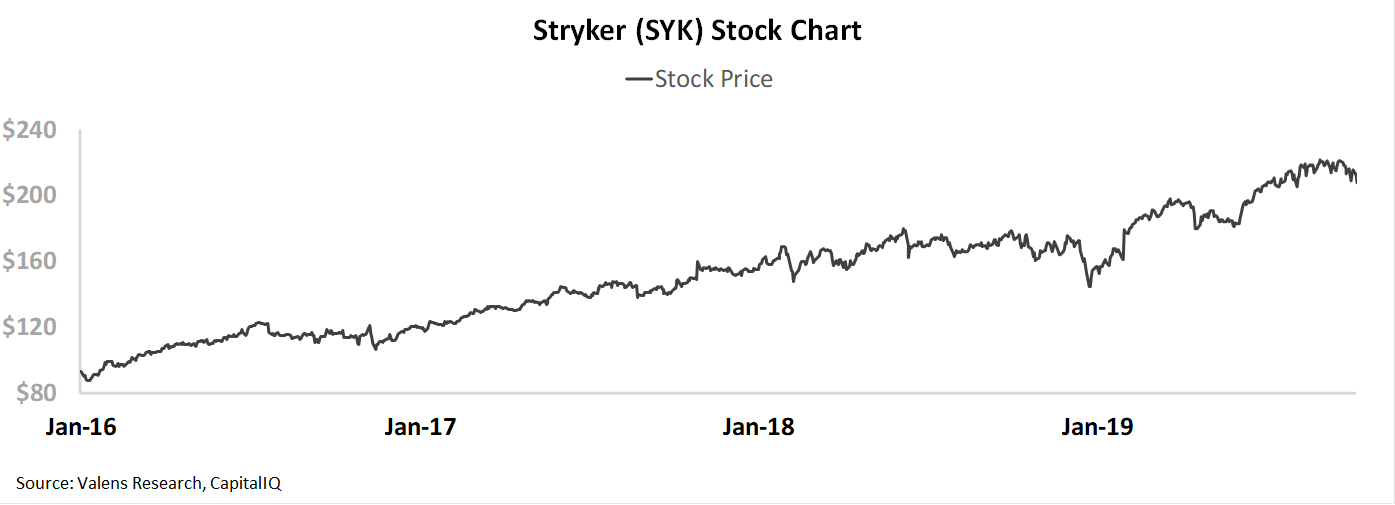
And that has the market very excited about Stryker. In the past 3 years, the stock has risen 125%.
Stryker is much more than just hips and knees. 45% of their revenue comes from MedSurg sales, 17% of their sales come from Neurotech & Spine, with the remainder coming from Ortho offerings like Knee and Hip replacements, among others. But their Ortho market is the part of their business the market pays attention to the most, and the market is excited.
So excited, that at the current stock price, the market is pricing in Stryker’s returns to stay at all-time highs going forward. The market is expecting the age wave and other factors to fuel peak profitability for Stryker. But, we’re seeing interesting signs from management’s recent calls that say there might be a negative inflection occurring for the company, in particular in their Ortho business, that could mean the market is going to be disappointed in the coming quarters.
Markets have bullish expectations for SYK, but management may be concerned about their acquisitions, regulation, and EPS
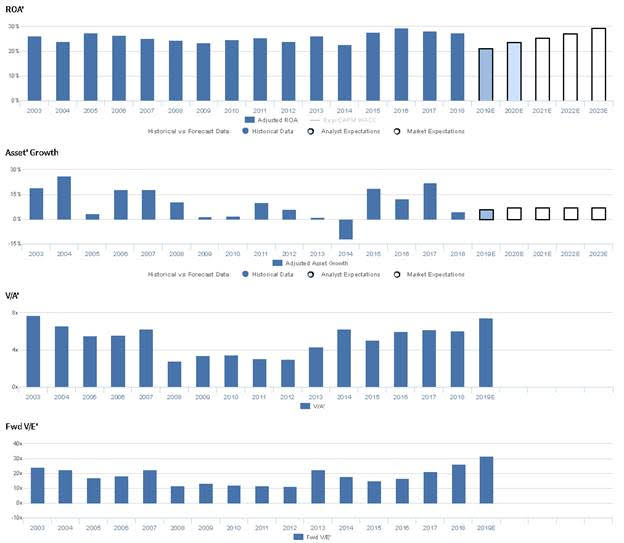
SYK currently trades near historical highs relative to UAFRS-based (Uniform) Earnings, with a 31.8x Uniform P/E. At these levels, the market is pricing in expectations for Uniform ROA to improve slightly, from 28% in 2018 to 30% in 2023, accompanied by 7% Uniform Asset growth going forward.
However, analysts have bearish expectations, projecting Uniform ROA to fade to 24% through 2020, accompanied by 6% Uniform Asset growth.
Historically, SYK has seen fairly stable, robust profitability, as they have successfully integrated and improved the profitability of numerous acquired businesses. After ranging from 24%-28% from 2003-2013, Uniform ROA briefly faded to 23% in 2014, before improving to 28%-30% levels through 2018. Meanwhile, Uniform Asset growth has been fairly consistent, positive in 15 of the past 16 years, while ranging from -12% to 26%, driven by the firm’s acquisitive growth strategy.
Performance Drivers – Sales, Margins, and Turns
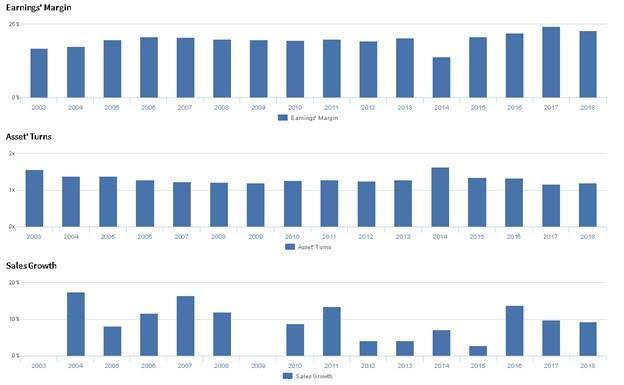
Trends in Uniform ROA have been driven by offsetting trends in Uniform Earnings Margin and Uniform Asset Turns. Uniform Margin expanded from 17% in 2003 to 19%-21% levels from 2005-2013, before collapsing to 14% in 2014, and recovering to 22%-24% levels from 2016-2018. Meanwhile, Uniform Turns fell from 1.6x in 2003 to 1.2x-1.3x levels from 2006 through 2018, excluding 1.6x outperformance in 2014. At current valuations, markets are pricing in expectations for a slight expansion in Uniform Margins, coupled with further stability in Uniform Turns.
Earnings Call Forensics
Valens’ qualitative analysis of the firm’s Q2 2019 earnings call highlights that management may lack confidence in their ability to continue sourcing profitable acquisition opportunities, and they may be concerned about continued regulatory headwinds in their international Shoulder business. Furthermore, they may lack confidence in their ability to sustain recent organic sales growth, Orthopedics growth, and Mako robot demand. Finally, they may be concerned about the sustainability of demand for their NOVADAQ product lines, and they may lack confidence in their ability to meet their full year sales and diluted EPS guidance.
UAFRS VS As-Reported
Uniform Accounting metrics also highlight a significantly different fundamental picture for SYK than as-reported metrics reflect. As-reported metrics can lead investors to view a company to be dramatically stronger or weaker than real operating fundamentals highlight. Understanding where these distortions occur can help explain why market expectations for the company may be divergent.
As-reported metrics significantly understate SYK’s profitability. For example, as-reported ROA for SYK was 8% in 2018, materially lower than Uniform ROA of 28%, making SYK appear to be a much weaker business than real economic metrics highlight. Moreover, Uniform ROA has expanded over the last twenty years, contrary to as-reported ROA that has fallen consistently, to single-digit levels recently, misleading investors to believe that SYK has different profitability trends than is accurate.
Today’s Tearsheet
Today’s tearsheet is for Facebook. The market’s expectations for Facebook’s UAFRS earnings growth are much more pessimistic than earnings growth is forecast to be for 2020. The combination of this and Facebook’s strong return profile are compelling, even though the company trades above market valuations.
Regards,
Joel Litman
Chief Investment Strategist


