
Taking a Look to See What the Greatest Value Investor Owns During the Pandemic

One of the greatest investors of all time attributes most of his investing success to learning under a failed playwright.
That failed playwright went on to become known as the author of two of the greatest books on value investing ever and one of the greatest teachers of investing as well.
We’ll look at how his greatest student is applying those teachings in his portfolio today. This would be an incredibly difficult task without Uniform Accounting (UAFRS).
In addition to examining the portfolio, we’re including a deeper look into his largest current holding, providing you with the current Uniform Accounting Performance and Valuation Tearsheet for that company.
Investor Essentials Daily:
Friday Uniform Portfolio Analytics
Powered by Valens Research
Note from Valens: Just before the pandemic, we wrote about what made Berkshire Hathaway one of the greatest portfolios of our time. To close the year, we wanted to revisit one of our first articles of the year and provide an update on how Warren Buffett has fared.
In the world of value investing, Ben Graham is the father, and maybe now also the grandfather, of successful value investing. Between Security Analysis in 1934 and Intelligent Investor published in 1949, he laid down the core framework that many of the greatest value investors have used and still build on today.
However, in 1934, while Ben Graham was writing Security Analysis, he was also attempting to get his own Broadway musical produced.
Graham had written Baby Pompadour, a play about a journalist whose writing is influenced by his singer mistress.
It had a semi-successful off-Broadway run, and Graham had gotten Irving Steinman, a producer, to back the production’s Broadway launch.
Steinman just had one condition, his fiancée, who was apparently not a very talented singer or actress, had to be the lead.
The play opened at the Vanderbilt Theater that stood for more than 35 years on West 48th Street. It ran for just one week.
It was a disaster. Critics panned the musical.
One stated:
“Graham had better…find himself a new hobby”
Another wrote:
“The only humor in his [Graham’s] comedy comes during those pathetic moments when the unfortunate actors – who are here spared the humiliation of identification – find themselves with nothing more to do than laugh at their own pitiful jokes”
The musical closed as a failure in short order, and Graham gave up on being a playwright, and instead turned his focus fully towards financial writing, investing, and teaching security analysis.
But while this failure may have been a big let-down for Graham, investors should be forever grateful that he was not successful as a playwright. Instead of dedicating his life to the arts, he dedicated his time to understanding investment research and teaching it to those who would listen.
Ben Graham’s greatest student was, of course, Warren Buffett. Buffett actually received an A+ in Graham’s investing class.
Warren Buffett summarized Graham’s teachings with this one comment:
“The basic ideas of investing are to look at stocks as businesses, use the market’s fluctuations to your advantage, and seek a margin of safety. That’s what Ben Graham taught us. A hundred years from now they will still be the cornerstones of investing.”
We also should be grateful that Graham didn’t have much success in the theater because if he had, Buffett might never have become the greatest practitioner of value investing.
Buffett studied under Graham shortly after Graham wrote Intelligent Investor. He earned his Master’s degree in Economics from Columbia in 1951. Studying under Ben Graham was a major draw for him in attending Columbia.
After leaving Columbia, Buffett took several stops through the world of finance, including working for Ben Graham’s investment partnership. Then Buffett gained control of Berkshire Hathaway.
Once he obtained control, he started investing the holding company’s money applying Graham’s principles – and produced phenomenal returns.
Over 50 years, Buffett’s Berkshire Hathaway produced an annualized 21.7% return, compared to a 9.8% return for the S&P 500. That’s roughly 12% a year in annualized alpha.
A $1,000 investment in the S&P 500 in 1965 would have been worth $97,000 by 2014. That same $1,000 invested in Berkshire Hathaway would have been worth over $15 million by 2014.
How does Buffett find companies where the market has mis-priced the business, offering a significant margin of safety and value investing opportunity?
One thing is for sure…he is not relying on the as-reported GAAP earnings numbers to conduct his analysis.
Buffett has said quite bluntly time and time again:
“The net earnings figure… it really is not representative of what’s going on in the business at all…”
“The GAAP rules… I’ve warned you about the distortions.”
“The ‘bottom line’ figures are totally capricious. It’s really a shame”
“You should concentrate on the world of companies, not arcane accounting mathematics.”
Buffett has regularly railed against issues with as-reported accounting metrics. He’s mocked the changes with net income causing Berkshire’s earnings to swing quarter to quarter in ways that completely misrepresent the company’s performance.
Buffett is not alone in recognizing that as-reported earnings numbers and other financial statement data are terribly problematic and misleading. He is certainly one of the more outspoken on the issue.
If the earnings number is not reliable, then neither is the as-reported earnings growth number. That makes the P/E, price to earnings ratio, just as useless.
Graham mentions the importance of a company’s “earning power” over a hundred times in his books. Unfortunately, as-reported earnings is a poor metric for examining a firm’s earning power.
So, any examination of Buffett’s portfolio, or your portfolio, using as-reported data would be a complete waste of time. It might be worse than that. Using as-reported financial data could cause you to make some very bad decisions… buying businesses that you shouldn’t, and selling businesses that you ought to have held.
That’s why Uniform Accounting and Uniform Financial Analytics are so powerful. Financial data that reflect the real economic performance and valuation of firms are necessary for great value investing. They unlock and reveal insights about the world of companies that arcane accounting – the existing accounting – hides and misleads.
Berkshire’s internal analysis unsurprisingly lines up directly with analysis using cleaned-up, consistent financial metrics calculated with Uniform Accounting.
We’ve conducted a portfolio audit of Berkshire’s top holdings, based on its most recent 13-F, in order to see how Buffett has adjusted during the pandemic.

On an as-reported basis, many of these companies are poor performers with returns at 10% or below, with the average as-reported return on assets (ROA) right around 9%.
In reality, the average company in the index displays an impressive average Uniform ROA of 44%.
Once we make Uniform Accounting (UAFRS) adjustments to accurately calculate earnings power, we can see the underlying strength of the portfolio.
Once the distortions from as-reported accounting are removed, we can see VeriSign (VRSN) does not have a return of 20%, but a sizable ROA of 224%.
Similarly, Mastercard’s (MA) ROA is really 86%, not at 22%. While as-reported metrics are portraying the company as a slightly above-average business, Uniform Accounting shows the company’s truly robust profitability.
The list goes on from there, for names ranging from Moody’s (MCO) and Visa (V), to AbbVie (ABBV).
One notable change from Berkshire’s portfolio snapshot back in January is its rotation out of airlines like Delta (DAL), Southwest (LUV), and United Airlines (UAL) and into healthcare companies like Bristol-Myers Squibb (BMY) and Merck (MRK).
Now, let us see how these firms’ returns can strengthen over time through EPS growth.
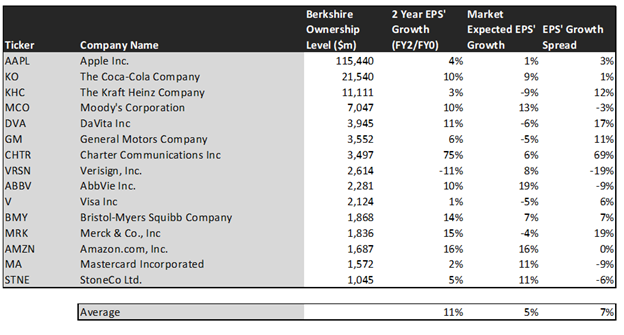
This chart shows three interesting data points:
- The 2-year Uniform EPS growth represents what Uniform earnings growth is forecast to be over the next two years. The EPS number used is the value of when we take consensus Wall Street estimates and we convert them to the Uniform Accounting framework.
- The market expected Uniform EPS growth is what the market thinks Uniform earnings growth is going to be for the next two years. Here, we show by how much the company needs to grow Uniform earnings in the next 2 years to justify the current stock price of the company. If you’ve been reading our daily analyses and reports for a while, you’ll be familiar with the term embedded expectations. This is the market’s embedded expectations for Uniform earnings growth.
- The Uniform EPS growth spread is the spread between how much the company’s Uniform earnings could grow if the Uniform earnings estimates are right, and what the market expects Uniform earnings growth to be.
The average company in the U.S. is forecast to have 5% annual Uniform Accounting earnings growth over the next 2 years. In comparison, these top stocks are forecasted by analysts for 3% Uniform earnings growth.
On average, the market is pricing these companies to shrink earnings by 10% a year. Analyst’s projections are well ahead of the market’s expectations.
One example of a company with high growth potential is AbbVie (ABBV). While analysts forecast AbbVie to grow by 10% over the next two years, the market expects the firm to see a 19% growth over the same period.
Another example is Charter Communications (CHTR). The company is reasonably priced, as the market expects Uniform earnings to grow by 6%, but the company is forecasted to in fact grow its EPS by 75% in the next two years.
That being said, there are many companies forecast to have earnings growth less than market expectations. For these companies, like General Motors (GM), Amazon (AMZN), and Moody’s (MCO), the market has growth expectations in excess of analysts’ predictions.
Ultimately, once we make uniform accounting adjustments, we can see that Berkshire is investing in high quality businesses, forecasted to grow in excess of market expectations.
SUMMARY and Apple Inc.’s Tearsheet
As Berkshire Hathaway’s largest individual stock holdings, we’re highlighting Apple, Inc. (APPL:USA) tearsheet today.
As the Uniform Accounting tearsheet for Apple highlights, their Uniform P/E trades at 27.8x, which is above global average valuation levels and its own historical average valuations.
High P/Es require high EPS growth to sustain them. In the case of Apple, the company has recently shown a 10% Uniform EPS growth.
Wall Street analysts provide stock and valuation recommendations that in general provide very poor guidance or insight. However, Wall Street analysts’ near-term earnings forecasts tend to have relevant information.
We take Wall Street forecasts for GAAP earnings and convert them to Uniform earnings forecasts. When we do this, Apple’s Wall Street analyst-driven forecast is a 19% Uniform EPS and a 3% Uniform EPS growth in 2021 and 2022, respectively.
Based on current stock market valuations, we can use earnings growth valuation metrics to back into the required growth rate to justify Apple’s $122 stock price. These are often referred to as market embedded expectations.
The company would need to grow its Uniform earnings by 10% each year over the next three years to justify their current valuation. What Wall Street analysts expect for Apple’s earnings growth is way above what the current stock market valuation requires in 2021, and way below that requirement in 2022.
Furthermore, the company’s earning power is 7x the corporate average. Also, cash flows are also more than 3x higher than its total obligations—including debt maturities, capex maintenance, and dividends. Together, this signals low credit and dividend risk.
To conclude, Apple’s Uniform earnings growth is well above its peer averages in 2020, and is also trading above average peer valuations.
Best regards,
Joel Litman & Rob Spivey
Chief Investment Strategist &
Director of Research
at Valens Research


