
This Is Hiding In Your Company’s IT Infrastructure

If you work in a larger company, you’ve probably experienced a “phishing test” or heard a story about someone who has.
Not an actual phishing event, where someone attempts to gain access to your company’s infrastructure. Rather, it is when your company’s IT and security team send out fake phishing emails to various people in the company, to test whether they were foolish enough to fall for the test. The goal being to train them to avoid the real thing.
For most people, that experience and tech support issues for reset passwords and the like are the beginning and end of when they really think about the technology infrastructure of their firm.
If you were to ask most people what powers their company, they’d say servers and databases from HP or Oracle, or the Windows and Office solutions from Microsoft. If they were closer to the IT side of the business, they might talk about Cisco and Broadcom solutions that enable their network, or solutions from VMWare to manage their infrastructure workload.
But there is a company lurking in that infrastructure stack that most people aren’t even aware exists. It’s a company called TechData (TECD), and they’re a core distributor of all that hardware and technology, connecting those vendors with the customers who leverage their technology every day.
Most might think that as a distributor and value added reseller, TechData would be a low return business. That is what the as-reported metrics show the business to be. But, once we make Uniform Accounting adjustments we see that returns are actually much more robust.
And we’re seeing interesting signs from management’s recent calls that say there might be more to the story going forward.
A Special Offer
This week we’re making a special webinar available to the readers of our Valens Research Institutional Daily.
This Thursday, at noon EST, we’re hosting a webinar to review our US equities Conviction Long Idea List.
Our Director of Research, Rob Spivey, will be highlighting our process for idea generation, and talking about our top picks, and our new picks for the quarter.
To register, click here. For Thursday, October 10th, at 12pm EST.
We look forward to having you on the webinar. It is a great introduction to how to use Uniform Accounting, and Valens’ research in your own investing process.
Market expectations are for a material decline in Uniform ROA, but management is confident about their cloud business, gross profit, and margins
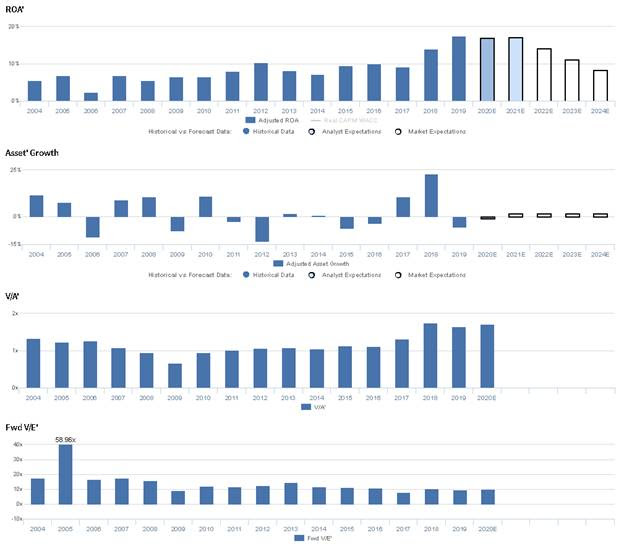
TECD currently trades below historical averages relative to UAFRS-based (Uniform) Earnings, with a 10.0x Uniform P/E. At these levels, the market is pricing in expectations for Uniform ROA to decline from 18% in 2019 to 8% in 2024, accompanied by 2% Uniform Asset growth going forward.
However, analysts have less bearish expectations, projecting Uniform ROA to only decline to 17% by 2021, accompanied by 1% Uniform Asset shrinkage.
Historically, TECD has seen cyclical profitability. After improving from 6% in 2004 to 10% in 2012, Uniform ROA fell back to 7% in 2014. Thereafter, Uniform ROA rose to 10% in 2016, before sliding to 9% in 2017 and improving materially to 18% in 2019 following their acquisition of AVT Technology Solutions. Meanwhile, Uniform Asset growth has been volatile, positive in nine of the past 16 years, while ranging from -13% to 23%.
Performance Drivers – Sales, Margins, and Turns

Trends in Uniform ROA have been driven by trends in both Uniform Earnings Margin and Uniform Asset Turns. Uniform Margins steadily increased from 1% to 2% from 2004 to 2019. Meanwhile, Uniform Turns expanded from 7.4x in 2004 to 8.8x in 2006, before fading to 6.9x in 2010. Thereafter, Uniform Turns jumped to 10.2x in 2015, compressed to 8.0x in 2017, and subsequently improved to peak 10.5x levels in 2019. At current valuations, markets are pricing in expectations for a reversal in recent trends in both Uniform Margins and Uniform Turns.
Earnings Call Forensics
Valens’ qualitative analysis of the firm’s Q2 2020 earnings call highlights that management is confident they are pleased with the financial performance of their cloud business, and they are confident gross profit increased 9% in the quarter. Furthermore, they are confident their Asia Pacific operating margin improved 42bps and that they are on track to meet their long-term 50-50 capital strategy. However, they may be concerned about their ability to continue repurchasing shares at a reasonable price and about the impact of their TS acquisition on their portfolio. Finally, they may lack confidence in their ability to internally improve processes
UAFRS VS As-Reported
Uniform Accounting metrics also highlight a significantly different fundamental picture for TECD than as-reported metrics reflect. As-reported metrics can lead investors to view a company to be dramatically stronger or weaker than real operating fundamentals highlight. Understanding where these distortions occur can help explain why market expectations for the company may be divergent.
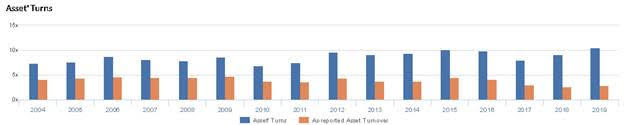
As-reported metrics significantly understate TECD’s asset efficiency, a key driver of profitability. For example, as-reported asset turnover for TECD was 2.9x in 2019, materially lower than Uniform Asset Turns of 10.5x that year, making TECD appear to be a much weaker business than real economic metrics highlight. Moreover, since 2017, as-reported asset turnover has decreased from 3.1x to 2.9x, while Uniform Asset Turns have increased from 8.0x to 10.5x over the same time period, directionally distorting the market’s perception of the firm’s historical asset efficiency.
Today’s Tearsheet
Today’s tearsheet is for Apple. Apple’s UAFRS valuations are below average, meaning the company trades at lower valuations than the market as a whole, with strong profitability.
Regards,
Joel Litman
Chief Investment Strategist


