
As-reported metrics show returns have declined massively, but this retail apocalypse target’s stock has rallied massively, UAFRS show’s who’s right

Amazon has wreaked havoc on retail over the last several years. Looking at the as-reported financials for this retail giant suggests this company got caught up in the storm. So why are shares up 5x more than the average retail company?
In some cases, the market could be missing something big, offering an opportunity to short the business. In the case of today’s featured company though, it might be the data that’s missing something.
Also below, Uniform Accounting Embedded Expectations Analysis and the Uniform Accounting Performance and Valuation Tearsheet for the company.
Investor Essentials Daily:
Thursday Tearsheets
Powered by Valens Research
We’ve written about the impact Amazon has had on the retail landscape, and no doubt you’ve heard from other outlets about the “retail apocalypse.”
We wrote about the impact this has had on Tanger Factory Outlets in one of our prior dailies and about the general retail market prior to that. The general theme has been that businesses that have been disrupted the most are those that sell products that are easily shipped.
Think non-perishable goods, textiles, or electronics—really anything that can be wrapped in plastic.
One company that really represents the “old guard” of retail is Target (TGT). The company has everything one could look for, from home goods, electronics, apparel, and even food. This made it ripe for electronic disruption.
As Amazon moved into perishable goods, the classic brick and mortar business, with the well-known bullseye logo became a picture of those companies that would be hurt by Amazon’s reign.
Looking at the firm’s ROA since 2016, that concern appears to have become a reality:

In the last several years, Target has seen ROA fall materially to 6.5%, levels not seen since the Great Recession. It is clear looking at this metric that Target has been losing the battle to Amazon.
So why are shares up so much in recent years?
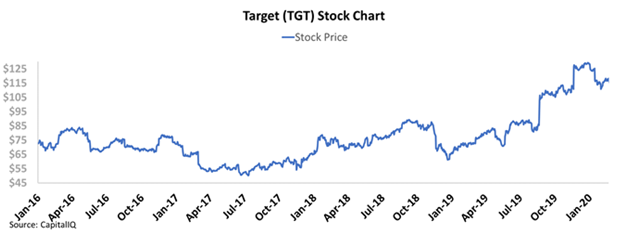
From the beginning of 2016 through the end of February 2020 (prior to major COVID-19 related issues for the whole market), shares of TGT were up 63%, slightly behind the overall market return of 79% during that time, and 5x higher than the S&P Retail ETF (XRT) return of 13%.
Clearly the market is missing the story for Target.
Or it’s possible the data is missing the story.
After making all of the adjustments under Uniform Accounting, it’s clear that the disruption for Target has been overstated by as-reported financial statements.
When looking at Target’s real profitability over the last few years, returns have been roughly flat in recent years, and are projected to remain at 2020 highs.

And the market has recognized that.
The market isn’t running away from fundamentals, ignoring a bad business just because it’s a well known brand. The market is recognizing that the real operational returns of this business have been much more stable than reported.
Unfortunately, while this means this isn’t offering us a short opportunity, the market recognizing the resiliency of the business means there isn’t a good opportunity to invest here either.
At current valuations, the market is already pricing in expectations for Target to see returns improve. In addition, management appears to have concerns about several potential operational headwinds for the business. Combined, these two points suggest the name is likely fully valued.
Target Corporation Embedded Expectations Analysis – Market expectations are for Uniform ROA to remain flat, but management appears concerned about inventory, margins, and growth
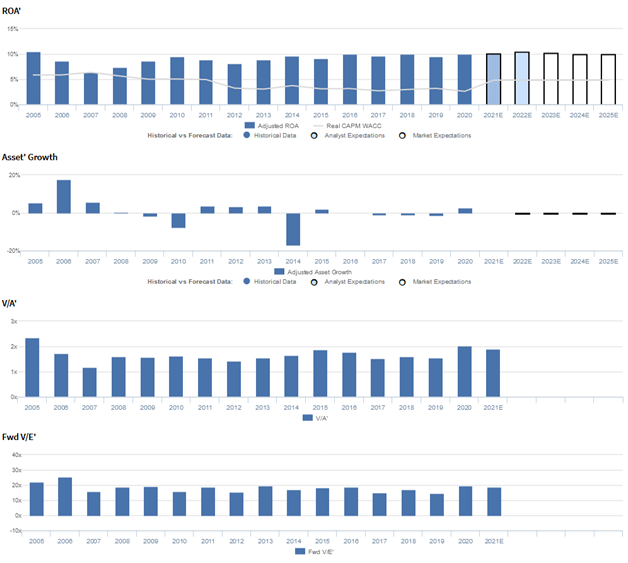
TGT currently trades below corporate averages relative to Uniform earnings with a 18.6x Uniform P/E (Fwd V/E’). At these levels, the market is pricing in expectations for Uniform ROA to remain flat at 10% levels going forward, accompanied by immaterial Uniform asset shrinkage.
Meanwhile, analysts have similar expectations, projecting Uniform ROA to slightly expand to 11% by 2022, accompanied by immaterial Uniform asset growth.
Historically, TGT has seen somewhat cyclical profitability. After declining from 11% in 2005 to 6% in 2007, Uniform ROA rebounded to 9% in 2010. Subsequently, Uniform ROA faded to 8% in 2012, before recovering to, and stabilizing at 9%-10% levels from 2014-2020.
Meanwhile, Uniform asset growth has been volatile, positive in just nine of the past sixteen years, while ranging from -17% to 18%.
Performance Drivers – Sales, Margins, and Turns
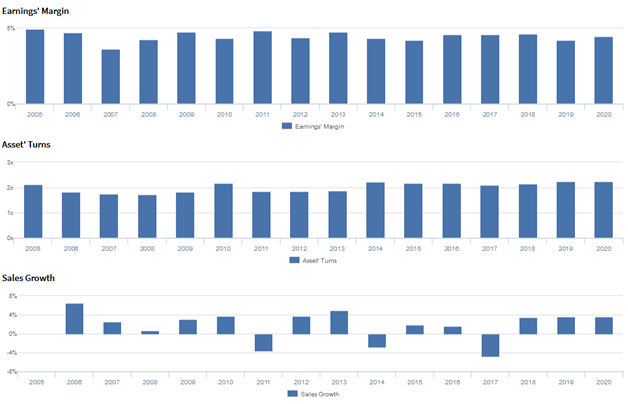
Trends in Uniform ROA have been driven by trends in Uniform asset turns, coupled with stability in Uniform earnings margins.
Since 2005, Uniform earnings margins have been relatively consistent, ranging from 4%-5% in each year.
Meanwhile, Uniform asset turns faded from 2.1x in 2005 to 1.7x in 2008, before rebounding to 2.2x in 2010. Since then, Uniform earnings margins declined to 1.9x in 2013, and have subsequently recovered to 2.2x in 2020.
At current valuations, markets are pricing in expectations for both Uniform asset turns and Uniform earnings margins to sustain current levels.
Earnings Call Forensics
Valens’ qualitative analysis of the firm’s Q4 2020 earnings call highlights that management may lack confidence in their ability to sustain top-line, operating margin, and EPS growth, improve operating income and bottom-line performance, and increase their dividend payout.
In addition, they may be concerned about the impact of COVID-19 on their supply chain, the potential of investments in high-touch services, and adjustments to their capital expenditure guidance.
Furthermore, management may be exaggerating the popularity of Target Circle and the speed and efficiency of Drive-Up, and they may be downplaying concerns about their clearance inventory levels.
They may also be overstating the health of their business and their ability to find sellers to supply products that complement their in-store offerings.
Moreover, management may be concerned about the continued increase in demand for stock-up items and the progress of their store remodeling, and they may be downplaying concerns about the strength of their brand and SG&A expense rate increases.
Additionally, they may lack confidence in their ability to sustain increases in Drive-up transaction sizes, accelerate beauty product performance, and add value to customers through Target Plus.
Finally, they may be exaggerating the quality of their same-day shopping services, and they may lack confidence in their ability to mitigate COVID-19 headwinds and sustain productivity at their top stores.
UAFRS VS As-Reported
Uniform Accounting metrics also highlight a significantly different fundamental picture for TGT than as-reported metrics reflect.
As-reported metrics can lead investors to view a company to be dramatically stronger or weaker than real operating fundamentals highlight. Understanding where these distortions occur can help explain why market expectations for the company may be divergent.
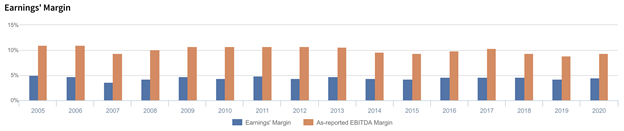
As-reported metrics significantly overstate TGT’s margins, one of the primary drivers of profitability.
For example, as-reported EBITDA margin for TGT was 9% in 2020, materially higher than Uniform earnings margin of 5% in the same year, making TGT appear to be a much stronger business than real economic metrics highlight.
Moreover, as-reported EBITDA margin has been nearly double Uniform earnings margins in each year since 2005, significantly distorting the market’s perception of the firm’s historical performance.
SUMMARY and Target Corporation Tearsheet
As the Uniform Accounting tearsheet for Target Corporation (TGT) highlights, Uniform P/E trades at 18.6x, which is below corporate average valuations but above its own historical average valuations.
High P/Es require high EPS growth to sustain them. In the case of Target, the company has recently shown a Uniform EPS growth of 15%.
Wall Street analysts provide stock and valuation recommendations that in general provide very poor guidance or insight. However, Wall Street analysts’ near-term earnings forecasts tend to have relevant information.
We take Wall Street forecasts for GAAP earnings and convert them to Uniform earnings forecasts. When we do this, Target’s Wall Street analyst-driven forecast is for robust Uniform EPS growth of 4% in 20201, and 6% Uniform EPS growth in 2022.
Based on current stock market valuations, we can back into the required earnings growth rate that would justify $104 per share. These are often referred to as market embedded expectations. In order to meet current market valuation levels, Target would have to have Uniform earnings shrink by 1% each year over the next three years.
What Wall Street analysts expect for Target’s earnings growth is higher than what the current stock market valuation requires.
Meanwhile, the company’s earnings power is 2x corporate averages, and their robust cash flows and cash on hand signal that there is low risk to the company’s operations and credit profile.
To conclude, both Target’s Uniform earnings growth and price to earnings are below peer averages.
Best regards,
Joel Litman & Rob Spivey
Chief Investment Strategist &
Director of Research
at Valens Research