
The difference between a great company and a great stock

There’s a lot of talk that we’re entering a tech bubble similar to the one in 1998-2000. With the benefit of years to study the markets, we have a different view.
Understanding the differences between a great company and a great stock is critical for investors when looking at any industry.
Investor Essentials Daily:
The Monday Macro Report
Powered by Valens Research
Last week, a new piece of analysis fanned the flames of the investing world. It restarted an ongoing debate about whether the market is currently in a massive bubble.
No, we aren’t talking about the WallStreetBets army from Reddit going to war with hedge funds over GameStop (GME), AMC (AMC), and other stocks, though that certainly had many spooked.
It was this chart published by Goldman Sachs, of its Non-Profitable Tech Index. This index is an equally weighted basket of technology companies that are not yet profitable.
The below chart measures the performance of the index starting in 2015, up until 2020. As you can see, in 2020 the index saw an exponential spike as these stocks took off after March lows.
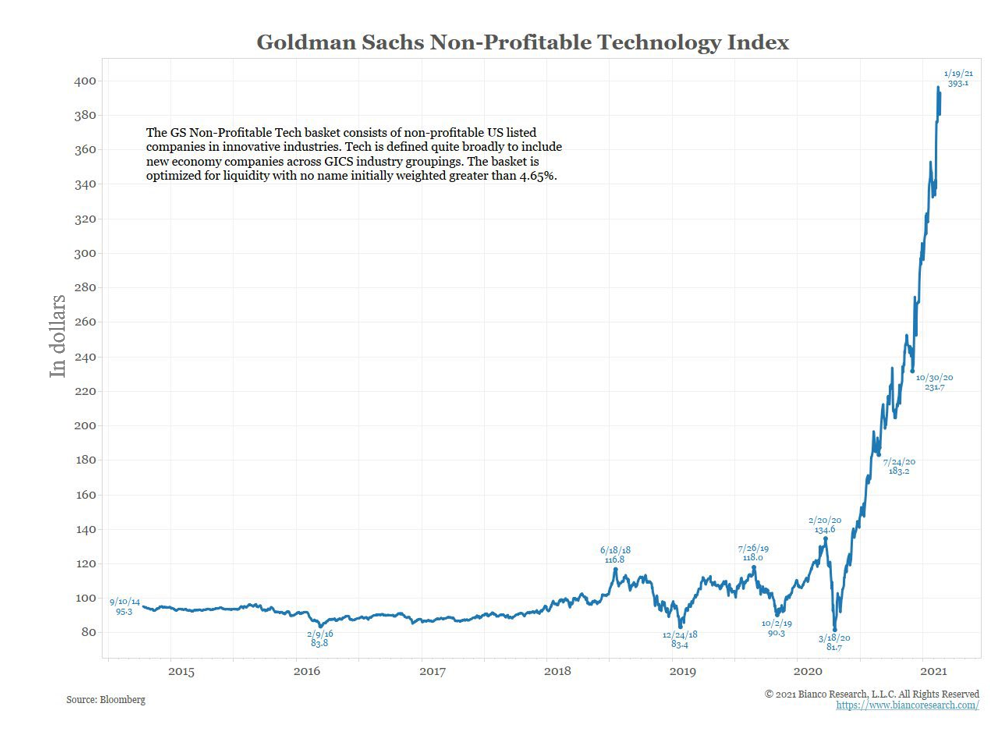
This growth of more than 400% beats out the S&P 500 and the Dow Jones over the same period. This is all from companies with no GAAP profitability.
Many point to this as a reason to think that the market is in a bubble that is heading for a collapse. Pundits are crying fundamentals and stock prices have become completely divorced from one another.
However, from years of study, we have a different view here at Valens.
Rather than being a bubble, this shocking result may come from using the wrong data.
While the Goldman Sachs data is initially alarming, there is more to ‘non-profitable’ companies than meets the eye. When the accounting distortions around stock option expense, R&D, and others are removed, a different picture emerges.
Uniform Accounting makes it clear many of these firms are throwing off large amounts of cash year after year.
After making the right accounting adjustments, companies like Tesla (TSLA), Shopify (SHOP), Spotify (SPOT), Workday (WDAY), Roku (ROKU), Peloton (PTON), Pinterest (PINS), Teladoc (TDOC), and other posterchildren of the “non-profitable tech” run have positive earnings.
That being said, the real factors behind the rally come down to a bigger topic to understand. This goes beyond the idea that as-reported metrics are not showing the real data.
This rally gets to the heart of the idea that there is a difference between a great company and a great stock.
Great companies are firms with high returns, impressive business models, and efficient operations. The owners of these businesses know cash can be generated from a minimal investment.
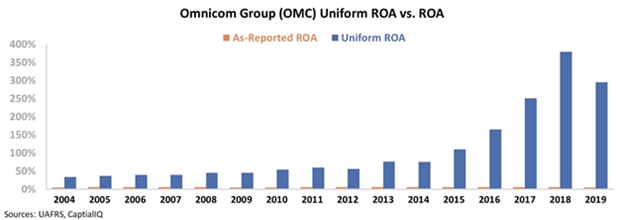
This is why businesses like Omnicom (OMC), the ad agency business with an impressive 400%+ ROA in 2019, are truly extraordinary, as businesses. Just because a business has extremely high ROA doesn’t translate to the company’s stock rocketing higher.
For instance, Omnicom’s as-reported ROA was 5% in 2018 while Uniform ROA was 400% in 2018. The Uniform metrics in this case are roughly 80 times higher than as-reported. Furthermore, GAAP accounting fails to show the improvement in profitability.
Again, this does not mean we believe the company’s stock will take off. It means that if investors are looking at the firm through its as-reported metrics, they will misunderstand how good the business actually is.
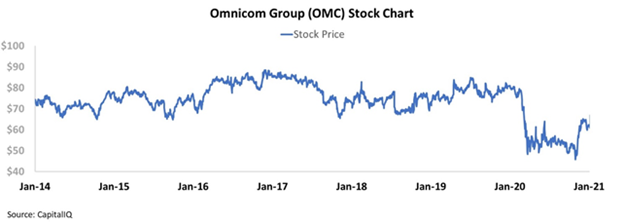
Since 2014, Omnicom has seen returns soar from 75% to 296%. Yet, the stock has fallen from $74 to $62 over this same period.
What actually makes a stock go up or down is not just how good the company is. It is how the company performs relative to expectations. And how that causes market expectations to change.
Great companies have high returns. Extraordinary companies are ones that have high returns while being able to grow at the same time.
Great stocks are companies that are able to generate earnings power at levels higher than what the market is pricing in for them to do. That is a different question entirely.
For Omnicom, the market already expected returns to skyrocket for the name before returns did rise. That is why the stock did not take off when the company’s profitability did.
We focus to understand just how wrong as-reported metrics are. Because we want to make sure you realize that you can’t use those metrics to value companies. They are just directionally wrong more often than not.
But just knowing Uniform profitability is better than what the as-reported metrics show it to be is not enough. You also need to take the next step, and understand what the market expects the company to do going forward, to figure out if the stock is undervalued or overvalued.
This is the power of the embedded expectations tool we use to analyze companies. It distills these expectations into one chart.
A stock may climb if the market expects ROA to collapse and returns only stay flat. It might also occur if the market expects a company to grow modestly, and the company actually sees fundamentals accelerate even faster than the market expects.
Many of the non-profitable tech firms we mentioned earlier in the Goldman Sachs index have taken off because of the At-Home Revolution. The At-Home Revolution has meant these firm’s business models are now more viable and relevant than they were before.
Due to this trend, people were suddenly in need of these firms’ products and services, and were willing to pay top dollar for them. The market did not expect these companies to hit a critical mass as fast as they did.
As the market did not expect this, the stocks rose until markets were pricing in this new reality.
And as these companies continue to take more share of the economy, the market will have to continue to adjust its expectations, pushing the stocks higher.
This can only be understood by looking at the context of what makes a good stock as opposed to a great company.
Best regards,
Joel Litman & Rob Spivey
Chief Investment Strategist &
Director of Research
at Valens Research


