
The end of the drive-in theater

In 2013, the last passenger car with a front bench seat, the Impala, rolled off the assembly line. By that point, the bench seat was optional, and cost $195 extra. This was a far cry from the days where Oldsmobiles had them stock, and when you rode around with your grandparents, you sat between them in the front seat… without a seat belt.
Many joke that the reason why bench seats became a thing in the US was because of the drive-in theater, for convenience for teenage dates. So, as the drive-in theater has faded away, that must have been the reason for the bench seat vanishing also?
In reality, American car makers just cared about cost when they implemented the bench seat. They were cheaper to make, and enabled car buyers to fit more people in a car.
But as more and more European cars entered the US market, as early as in the 1950s, bucket seats became cooler. Americans wanted a sportier feel for their car, and they were willing to pay for it.
Ever since, seats have steadily moved from an afterthought in a car, to a premium offering, key to customization, and to the “premium-ization” of the commodity car market.
First came power adjustability as opposed to classic handles. Then came leather being practically standard for many cars, even lower end models for Honda or Toyota. Now, it’s not uncommon to see heating and cooling seats offered for an Accord, a Camry, or a Fusion.Sometimes, even in the rear seats.
As more and more spending in a car ends up in the seats people sit in, one company in particular has benefited.Lear (LEA) supplies seats for OEMs to install in cars, ranging from base models up to premium models with full movement and heating and cooling functionality, among other options.
The market doesn’t appear to care about Lear benefiting from this great spend in their core product area. The market is concerned that, with a recession likely imminent (contrary to our macro work, more on that later in this newsletter), Lear will roll over, as will the entire market.
In reality, our Uniform Accounting shows that not to be the case. While the market has priced the company for returns to fall towards levels last seen in the Great Recession, the company continues to have strong Uniform Accounting returns, and management is showing confidence about fundamental drivers that may enable them to buck the expected trend.
Monthly Macro – Market Phase Cycle Release Webinar
At noon this Thursday our Director of Research, Rob Spivey, will be hosting a webinar to review our October Market Phase Cycle macro analysis, which comes out at the same time on Thursday.
If you’d like to register, please click here. The webinar will be 30 minutes.
On the call, Rob will be discussing what macro signals we are seeing this month, as we review our Uniform Accounting equity and credit insights, our credit cycle data, sentiment indicators, and the other systematic tools.
We have used these tools to identify key market inflections like in late 2015, early 2016, November of 2017, and this July.
We’ve repeatedly had clients tell us these webinars are the most insightful they attend, for both their investing strategy, and for helping give a cogent explanation of their macro view to clients.
I hope you can attend.
Market expectations are for Uniform ROA to reach 10-year lows, but management is confident about costs, growth, and their manufacturing capabilities
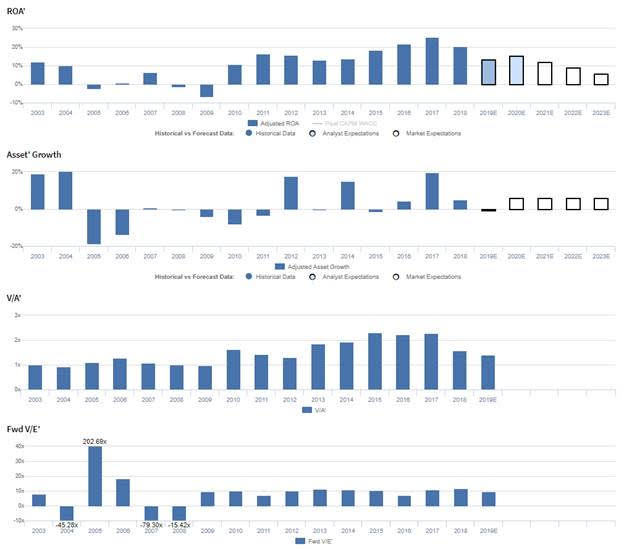
LEA currently trades well below corporate averages relative to Uniform Earnings, with a 9.5x Uniform P/E. At these levels, the market is pricing in expectations for Uniform ROA to contract from 20% in 2018 to 6% in 2023, accompanied by 6% Uniform Asset growth going forward.
Analysts have similar expectations, projecting Uniform ROA to fall to 15% through 2020, accompanied by 1% Uniform Asset shrinkage.
Prior to 2010, LEA had seen overall declines in profitability, with Uniform ROA falling from a peak of 12% in 2003 to a low of -7% in 2009. However, in 2010, Uniform ROA rebounded to 11%, before stabilizing at 13%-16% levels through 2014, and eventually expanding to 25% in 2017, before falling to 20% in 2018. Meanwhile, Uniform Asset growth has been volatile, positive in just eight of the past 16 years, and ranging from -19% to 20%.
Performance Drivers – Sales, Margins, and Turns
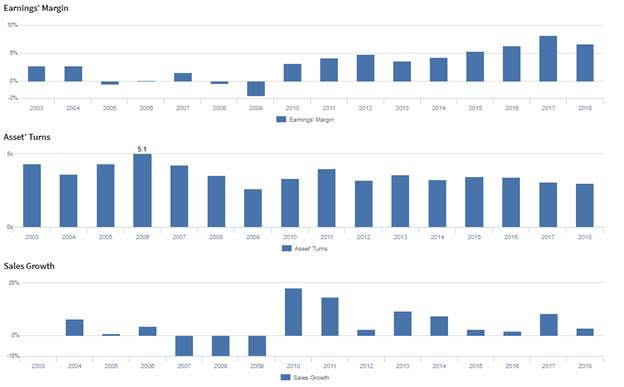
Recent improvements in profitability have been driven by expanding Uniform Earnings Margin, supported by stable Uniform Asset Turns. While Uniform Margins fell from 3% levels in 2003-2004 to -3% in 2009, they have since steadily improved to a high of 8% in 2017 before compressing slightly back to 7% in 2018. Meanwhile, Uniform Turns, which fell from a high of 5.1x in 2006 to just 2.6x by 2009, rebounded to 4.0x in 2011, and have since stabilized at 3.0x-3.6x levels. At current valuations, markets are pricing in expectations for a reversal in recent Uniform Margins improvements, coupled with a decline in Uniform Turns.
Earnings Call Forensics
Valens’ qualitative analysis of the firm’s Q2 2019 earnings call highlights that management is confident they are committed to making investments that drive profitable growth, and they are confident manufacturing certain components internally adds value and margin. Furthermore, they are confident their recent growth investments will not increase costs.
However, they generated multiple highly questionable markers when discussing the competitive positioning of their E-Systems segment. Furthermore, they may lack confidence in their ability to realize $75 million in annualized savings from their restructuring efforts, quickly scale production, and efficiently invest for future growth. Finally, they may be concerned about their ability to exit unprofitable businesses and about the sustainability of growth drivers in their segments.
UAFRS VS As-Reported.
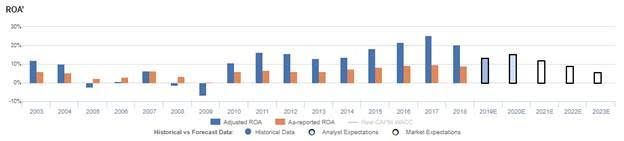
Uniform Accounting metrics also highlight a significantly different fundamental picture for LEA than as-reported metrics reflect. As-reported metrics can lead investors to view a company to be dramatically stronger or weaker than real operating fundamentals highlight.Understanding where these distortions occur can help explain why market expectations for the company may be divergent.
As-reported metrics significantly understate LEA’s profitability. For example, as-reported ROA for LEA was just 9% in 2018, substantially lower than Uniform ROA of 20%, making LEA appear to be a much weaker business than real economic metrics highlight. Moreover, Uniform ROA has been at least 2x higher than as-reported ROA in each year since 2010, significantly distorting the market’s perception of the firm’s profitability.
Today’s Tearsheet
Today’s tearsheet is for Visa. While Visa trades at premium valuations relative to the market, market expectations for Visa’s adjusted earnings growth is significantly lower than Visa’s actual forecasted earnings growth is, meaning the name is not as expensive as it initially appears.
Regards,
Joel Litman
Chief Investment Strategist


