
The infamous corporate raider’s market cap halved because of a short report

One of the most intriguing things that happened in the markets last month was surely the battle between the Wall Street legend Carl Icahn and highly-renowned short-seller Hindenburg Research.
Since Hindenburg released a detailed report on Icahn Enterprises at the beginning of May, Icahn’s company’s market cap fell by more than 50%.
The short seller was accusing Icahn of inflating asset values and having an unsustainable dividend yield, which was unsupported by its cash flows and investment performance.
Icahn responded harshly and said it is a disinformation campaign to distort the company’s image and reputation while calling the short-seller “Blitzkrieg Research”.
Today, we will take a closer look at Icahn’s top holdings and understand if it looks like Hindenburg has a case or not.
In addition to examining the portfolio, we include a deeper look into the fund’s largest current holding, providing you with the current Uniform Accounting Performance and Valuation Tearsheet for that company.
Also below is a detailed Uniform Accounting tearsheet of the fund’s largest holding.
Investor Essentials Daily:
Friday Uniform Portfolio Analytics
Powered by Valens Research
The infamous corporate raider and activist investor Carl Icahn found himself in the midst of controversy following a report by Hindenburg Research last month.
On the same day that the report was released, Icahn Enterprises’ stock fell by around 20%.
The report accused Icahn and his company of inflated valuation marks, and that it relies on a Ponzi-like scheme to pay its massive dividends.
Hindenburg mentions that the company was trading at a huge premium to its last reported net asset value (NAV), far exceeding industry comparables.
For instance, other funds run by star managers like Dan Loeb’s Third Point and Bill Ackman’s Pershing Square trade at significant discounts to their NAV, let alone a massive premium.
Additionally, Icahn Enterprises’ current dividend yield is around 16%, making it the highest dividend yield of any U.S. large-cap company by far, with the next closest at about 10%.
The report points out that investors are attracted to IEP due to the high dividend yield but in reality, it is unsustainable for the company’s financial health.
Most importantly, Hindenburg argues that the firm has been using new investors’ money to pay out dividends to old investors.
The company has raised its dividend three times since 2014 while its investment portfolio has lost 53% and its free cash flow declined by almost $5 billion over the same period.
With that underperformance, it’s almost impossible to maintain this huge dividend yield.
However, Icahn responded to the report shortly and denied the allegations while referring to Hindenburg as “Blitzkrieg Research” since it uses destructive tactics and spreads disinformation.
He said that the company will continue to pay its $2 per unit dividend, which he says is sustainable due to his substantial ownership stake in the company of around 70%.
Furthermore, Icahn justifies the premium to NAV by pointing out that comparing his firm and other closed-end funds is like “comparing apples to oranges” since the company doesn’t charge fees to investors.
He also added that the firm uses industry-standard valuation methods and it was assisted by third-party consultants.
In light of this controversy, let’s have a look at the top holdings of Icahn’s portfolio and see if Hindenburg is right about shorting the company.
Economic productivity is massively misunderstood on Wall Street. This is reflected by the 130+ distortions in the Generally Accepted Accounting Principles (GAAP) that make as-reported results poor representations of real economic productivity.
These distortions include the poor capitalization of R&D, the use of goodwill and intangibles to inflate a company’s asset base, a poor understanding of one-off expense line items, as well as flawed acquisition accounting.
It’s no surprise that once many of these distortions are accounted for, it becomes apparent which companies are in real robust profitability and which may not be as strong of an investment.
See for yourself below.
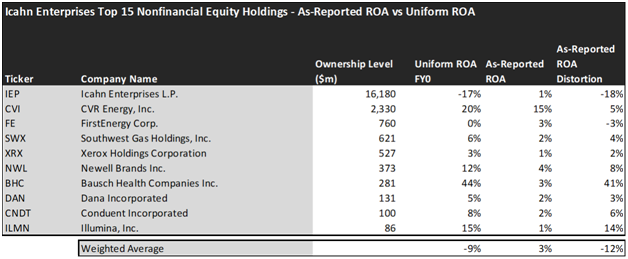
Looking at Icahn Enterprises’ top holdings we can see the reason for its underperformance in the last few years.
On an as-reported basis, many of the companies in the fund are poor performers. The average as-reported ROA for the top 10 holdings of the fund is 3%, which is way below the U.S. corporate average.
However, once we make Uniform Accounting adjustments to accurately calculate the earning power, we can see that the average return in Icahn Enterprises’s top 10 holdings is even worse. The portfolio is unprofitable with a -9% Uniform ROA.
As the distortions from as-reported accounting are removed, we can see that FirstEnergy (FE) isn’t a 3% return business. Its Uniform ROA is actually 0%.
Meanwhile, Icahn Enterprises (IEP) itself looks like it’s barely profitable with only a 1% return. In reality, this holding company is significantly unprofitable with a -17% Uniform ROA.
That being said, to find companies that can deliver alpha beyond the market, just finding companies where as-reported metrics misrepresent a company’s real profitability is insufficient.
To really generate alpha, any investor also needs to identify where the market is significantly undervaluing the company’s potential.
These dislocations demonstrate that most of these firms are in a different financial position than GAAP may make their books appear. But there is another crucial step in the search for alpha. Investors need also to find companies that are performing better than their valuations imply.
Valens has built a systematic process called Embedded Expectations Analysis to help investors get a sense of the future performance already baked into a company’s current stock price. Take a look:

This chart shows four interesting data points:
- The average Uniform ROA among Icahn Enterprises’ top 10 holdings is actually -9%, which is significantly worse than the corporate average in the United States.
- The analyst-expected Uniform ROA represents what ROA is forecasted to do over the next two years. To get the ROA value, we take consensus Wall Street estimates and convert them to the Uniform Accounting framework.
- The market-implied Uniform ROA is what the market thinks Uniform ROA is going to be in the three years following the analyst expectations, which for most companies here are 2023, 2024, and 2025. Here, we show the sort of economic productivity a company needs to achieve to justify its current stock price.
- The Uniform P/E is our measure of how expensive a company is relative to its Uniform earnings. For reference, the average Uniform P/E across the investing universe is roughly 20x.
Embedded Expectations Analysis of Icahn Enterprises paints a clear picture. Over the next few years, Wall Street analysts expect the companies in the fund to increase their profitability but still stay at unprofitable levels.
On the other hand, the market thinks these companies will perform much better in the next few years and is pricing in a significant improvement in profitability.
Analysts forecast the portfolio holdings on average to see Uniform ROA reach around -5% over the next two years. At current valuations, the market’s expectations are much higher than analysts and it expects a 9% Uniform ROA for the companies in the portfolio.
For instance, Xerox (XRX) returned 3% this year. Analysts think its returns will improve slightly to 5%. At a 26.3x Uniform P/E, the market expects profitability to increase even further and is pricing Uniform ROA to be around 7%.
Similarly, FirstEnergy’s (FE) Uniform ROA is 0%. Analysts expect its returns will slightly improve to 3%, but the market is more optimistic about the company and pricing its returns to reach 7%.
Overall, we can understand the factors Hindenburg has been pointing out and the reason why Icahn’s portfolio has been underperforming when looking at the portfolio.
On average, the companies in the portfolio are unprofitable and the market has high expectations for these names over the next few years. This significantly limits the upside potential as these companies should focus on increasing their profitability and might not be appreciated by the market as it has been already expecting this improvement.
Additionally, over 70% of the portfolio consists of the company’s own shares which significantly decreases diversification in the portfolio that investors would prefer in a turbulent market environment we are currently experiencing.
Lastly, the allure of the portfolio lies in its massive dividend yield but investors should be highly cautious to consider the risks associated with the company and its current valuations before making any investment decisions.
This just goes to show the importance of valuation in the investing process. Finding a company with strong profitability and growth is only half of the process. The other, just as important part, is attaching reasonable valuations to the companies and understanding which have the upside that has not been fully priced into their current prices.
To see a list of companies that have great performance and stability also at attractive valuations, the Valens Conviction Long Idea List is the place to look. The conviction list is powered by the Valens database, which offers access to full Uniform Accounting metrics for thousands of companies.
Click here to get access.
Read on to see a detailed tearsheet of one of Icahn Enterprises’ largest holdings.
SUMMARY and Icahn Enterprises L.P. Tearsheet
As one of Icahn Enterprises’ largest individual stock holdings, we’re highlighting Ícahn Enterprises L.P. (IEP:USA) tearsheet today.
As the Uniform Accounting tearsheet for Enterprises L.P. highlights, its Uniform P/E trades at -12.9x, which is below the global corporate average of 18.4x, and its historical average of 15.3x.
Low P/Es require low EPS growth to sustain them. In the case of Enterprises L.P., the company has recently shown 238% Uniform EPS growth.
Wall Street analysts provide stock and valuation recommendations that, in general, provide very poor guidance or insight. However, Wall Street analysts’ near-term earnings forecasts tend to have relevant information.
We take Wall Street forecasts for GAAP earnings and convert them to Uniform earnings forecasts. When we do this, Enterprises L.P.’s Wall Street analyst-driven forecast is for EPS to shrink by 26% and 21% in 2023 and 2024, respectively.
Furthermore, the company’s return on assets was -17% in 2022, which is below the long-run corporate averages. Also, cash flows and cash on hand fall short of its total obligations—including debt maturities and CAPEX maintenance. Moreover, its intrinsic credit risk is 160bps above the risk-free rate. Together, these signal high dividend risks and moderate credit risks.
Lastly, Enterprises L.P.’s Uniform earnings growth is in line with peer averages, and it is below peer valuations.
Best regards,
Joel Litman & Rob Spivey
Chief Investment Strategist &
Director of Research
at Valens Research