
The market’s appreciation of this chocolatier’s decision to roll-up healthier brands looks idiotic until Uniform Accounting data is reviewed

This company continues to be known as the most recognizable chocolate brand, seen at every grocery and convenience store.
Nowadays, the company has grown to be more than just a chocolatier, expanding its product offerings through continuous acquisitions. As-reported metrics are frowning upon this strategy, but Uniform Accounting reveals the value hidden within these plays.
Also below, Uniform Accounting Embedded Expectations Analysis and the Uniform Accounting Performance and Valuation Tearsheet for the company.
Investor Essentials Daily:
Thursday Tearsheets
Powered by Valens Research
We’ve talked before about how despite the existing academic literature of acquisitions destroying value, certain well-executed acquisitions can create immense value.
In the case of Ball Corporation (BLL), the company was able to bring something special to the acquired business. The whole became greater than the sum of the acquiring and the acquired company’s parts.
One way of identifying a beneficial acquisition is through a robust business model. The Danaher Business System is a good example of such a model. It is based on various Lean/Six Sigma styles of management and is widely held as a fantastic model in business schools.
Danaher Corporation’s business system has been successful in identifying targets the company could unlock value by acquiring. It is unsurprising that during its recent acquisition of General Electric’s biopharma business, the market has responded positively well.
Even if Danaher “overpays” slightly on acquisitions, its business system can make those new acquisitions valuable almost immediately because it unlocks incremental earnings and growth.
A company that doesn’t come to people’s minds when thinking about quality acquisitions is The Hershey Company (HSY). Once famous only for its chocolate bars, the company now leads the global chocolate and non-chocolate confectionery market through the strategic acquisition of key snacking brands, most recently Amplify, Pirate, and One Brands.
Hershey has had consistently decent as-reported return on assets (“ROA”) of more than 2x cost-of-capital levels. That is, until recently, when as-reported ROA has started to crater, making investors wonder if the company’s portfolio expansion to healthier snacks isn’t helping the company anymore.
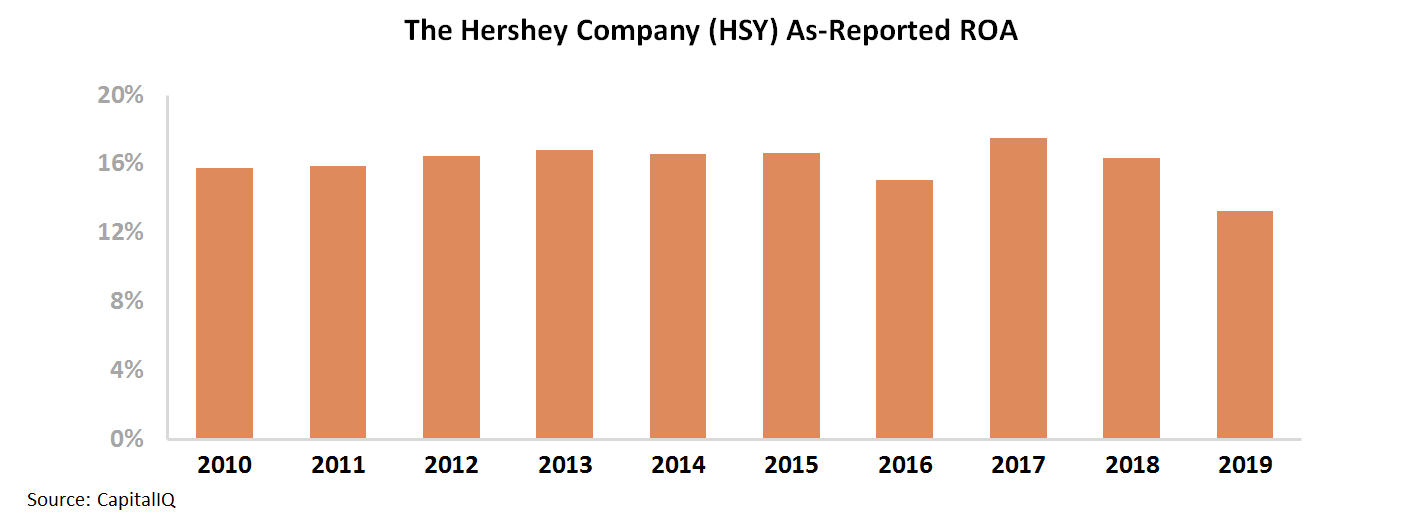
Investors looking at these numbers naturally are concerned that Hershey may have pursued the wrong strategy with its recent growth.
In reality though, investors looking at this data are being misled by incorrect GAAP accounting.
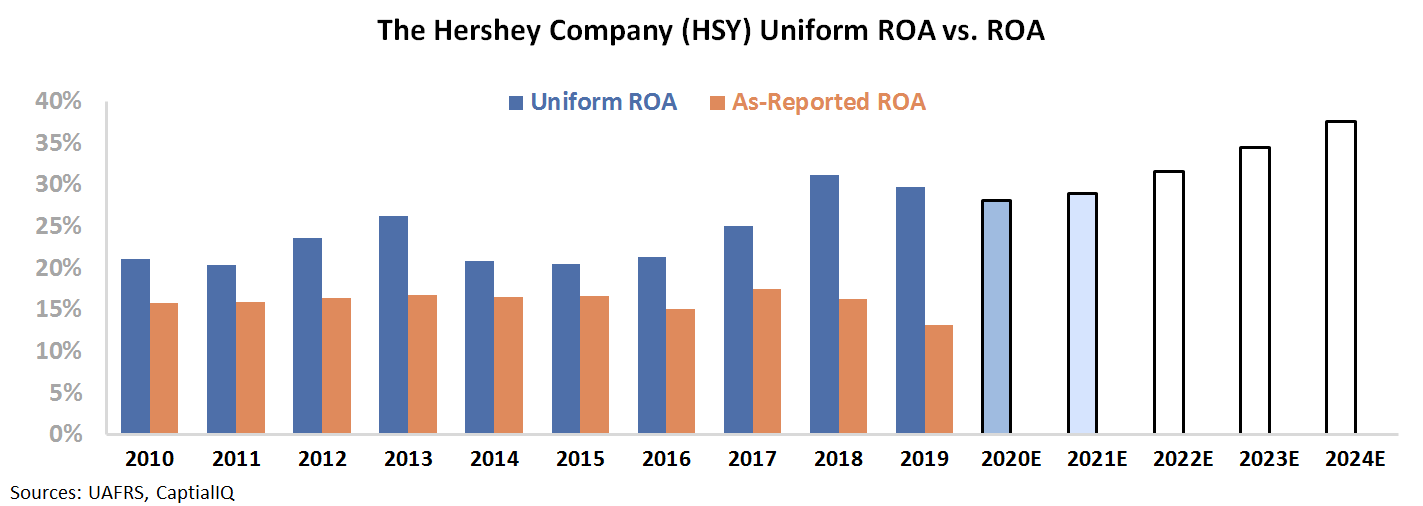
Once Uniform Accounting adjustments are made to remove those distortions, it is clear Hershey has been generating historically high returns. The company has been able to utilize its efficient distribution network, strong sales force, and economies of scale to quickly generate value from its new brands.
Meanwhile, Hershey is also capitalizing on the rapidly growing healthy snack segment, fortifying their snack market leadership in the U.S.
Hershey’s Uniform ROA highlights that not only is the firm operating stronger than what as-reported metrics reflect, but also its earnings are growing as a result of the successful execution of its acquisition strategy.
More importantly, the M&A experience management gathered in the past two years gives investors reason to be bullish about Hershey’s ability to generate further value.
While investors looking at as-reported metrics may be scratching their heads trying to understand why the market is paying a premium for the business, it’s obvious to those looking at the real numbers why the market is expecting returns to continue expanding.
The Hershey Company Embedded Expectations Analysis – Market expectations are for Uniform ROA to expand, but management may be concerned about pricing, growth, and Krave
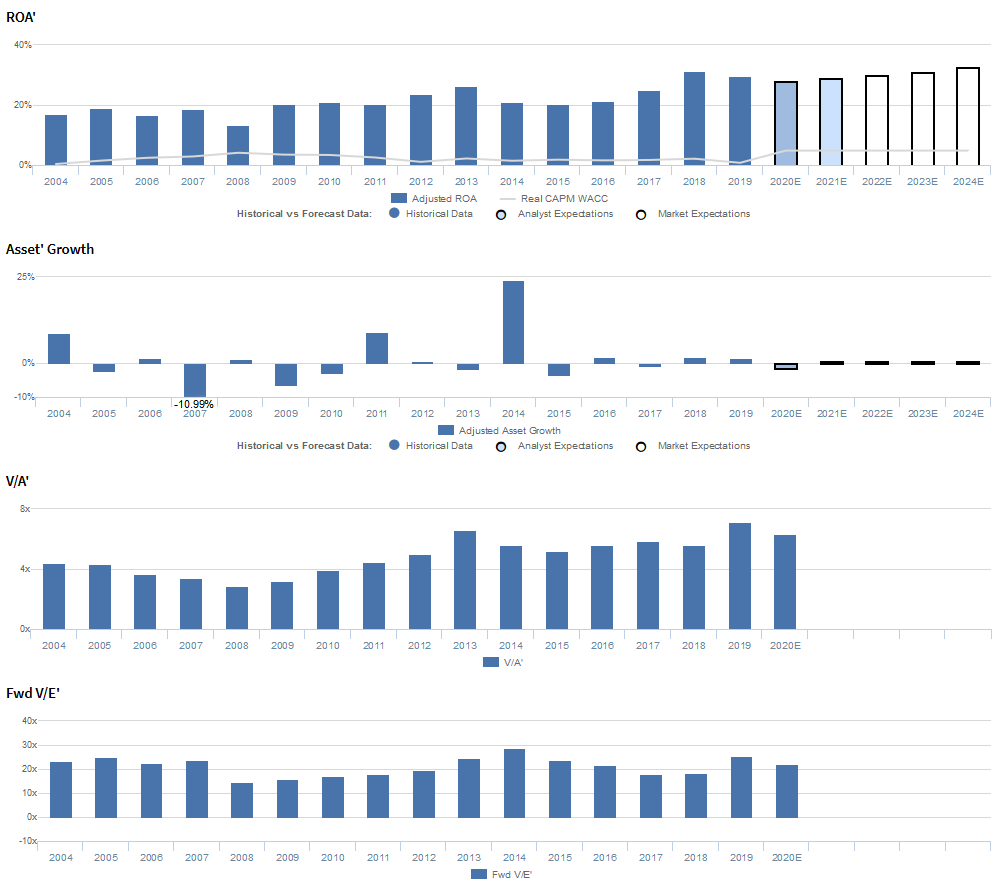
HSY currently trades near corporate averages relative to Uniform earnings, with a 23.4x Uniform P/E (Fwd V/E’).
At these valuations, the market is pricing in expectations for Uniform ROA to expand from 30% in 2019 to 34% in 2024, accompanied by immaterial Uniform asset growth going forward.
Meanwhile, analysts have less bullish expectations, projecting Uniform ROA to fade slightly to 28%-29% levels through 2021, accompanied by 2% Uniform asset shrinkage.
As a leading consumer staples company, HSY has historically seen robust profitability, with Uniform ROA experiencing material improvements following the Great Recession.
From 2004 to 2007, Uniform ROA ranged from 17% to 19%, before fading to a historical low of 13% in 2008, amidst the financial crisis. Since then, Uniform ROA recovered to 26% in 2013, before slipping to 21% by 2015 and rebounding to current 30% levels in 2019.
Meanwhile, Uniform asset growth has historically been volatile, positive in just nine of the past sixteen years, while ranging from -11% to 24%.
Performance Drivers – Sales, Margins, and Turns

Improvements in Uniform ROA have been driven by improvements in Uniform earnings margins, slightly offset by trends in Uniform asset turns. Uniform margins faded from 14% levels in 2004-2005 to 9% in 2008.
Thereafter, Uniform margins stabilized at 12%-13% levels through 2016, before expanding to 19% in 2019.
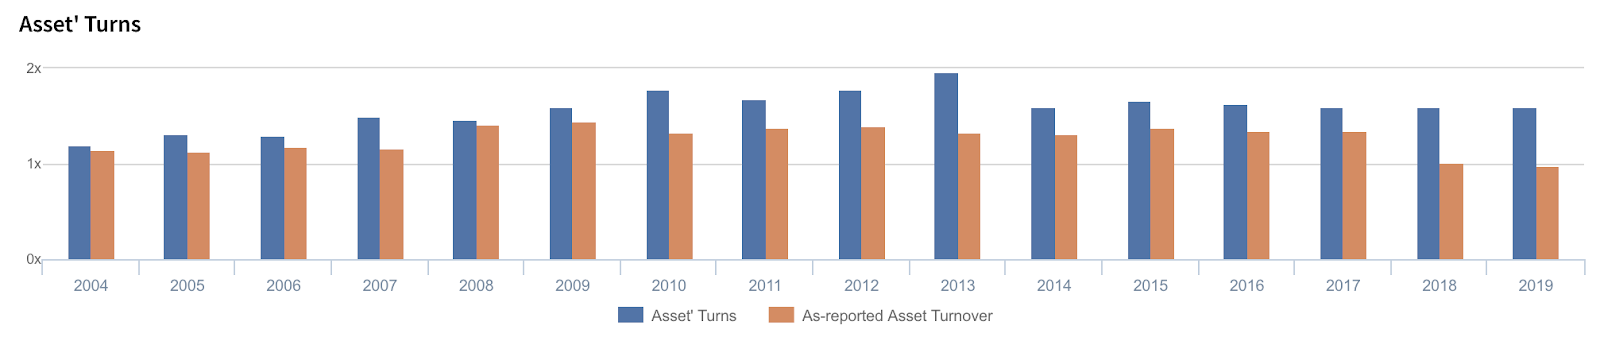
Meanwhile, after steadily improving from 1.2x in 2004 to a peak of 2.0x in 2013, Uniform turns compressed to 1.6x levels through 2019.
At current levels, markets appear to be pricing in expectations for further improvements in Uniform margins, accompanied by an expansion in Uniform turns.
Earnings Call Forensics
Valens’ qualitative analysis of the firm’s Q4 2019 earnings call highlights that management is confident their previous large-scale supply chain projects were focused on capacity utilization and margin enhancement and that their growth is more price-driven than volume-driven in years with pricing strength.
However, management may lack confidence in their ability to sustain net price realization improvements, mitigate FX headwinds, and continue to gain candy, mint, and gum category share.
In addition, they may lack confidence in their ability to sustain solid snack portfolio growth and Take5’s repeat purchase strength.
Furthermore, they may have concerns about their operating leverage and the impact of COVID-19, and they may be downplaying concerns about the drag of Krave on total consumption and enterprise resource planning constraints.
Finally, they may be overstating the importance of their Krave acquisition and the potential of their new trade model in Mexico.
UAFRS VS As-Reported
Uniform Accounting metrics also highlight a significantly different fundamental picture for HSY than as-reported metrics reflect.
As-reported metrics can lead investors to view a company to be dramatically stronger or weaker than real operating fundamentals highlight. Understanding where these distortions occur can help explain why market expectations for the company may be divergent.
As-reported metrics significantly overstate HSY’s turns, one of the primary drivers of profitability. For example, as-reported asset turnover for HSY was 1.0x in 2019, materially lower than Uniform asset turnover of 1.6x in the same year, making HSY appear to be a much weaker business than real economic metrics highlight.
Moreover, Uniform asset turnover has been consistently above as-reported asset turnover in each year since 2004, significantly distorting the market’s perception of the firm’s historical performance for almost two decades.
SUMMARY and The Hershey Company Tearsheet
As the Uniform Accounting tearsheet for The Hershey Company (HSY) highlights, the Uniform P/E trades at 23.4x, which is around corporate average valuation levels, but above its own recent history.
Average P/Es require average EPS growth to sustain them. In the case of Hershey, the company has recently shown a 3% Uniform EPS shrinkage.
Wall Street analysts provide stock and valuation recommendations that in general provide very poor guidance or insight. However, Wall Street analysts’ near-term earnings forecasts tend to have relevant information.
We take Wall Street forecasts for GAAP earnings and convert them to Uniform earnings forecasts. When we do this, Hershey’s Wall Street analyst-driven forecast is a shrinkage of 6% in 2020, followed by a 8% growth in 2021.
Based on current stock market valuations, we can use earnings growth valuation metrics to back into the required growth rate to justify Hershey’s $136 stock price. These are often referred to as market embedded expectations.
To justify the current valuation, the company would need to grow Uniform earnings by 2% each year over the next three years. What Wall Street analysts expect for HSY’s earnings growth is above what the current stock market valuation requires in 2021.
Furthermore, the company’s earning power is 5x the corporate average. Also, cash flows are significantly higher than its total obligations—including debt maturities, capex maintenance, and dividends. Together, this signals low credit and dividend risk.
To conclude, Hershey’s Uniform earnings growth is above peer averages but the company is trading below average peer valuations.
Best regards,
Joel Litman & Rob Spivey
Chief Investment Strategist &
Director of Research
at Valens Research


