
This activist investor took on Microsoft and won

Activist investing has gotten a poor reputation in recent years. Much of this reputation comes from some activist investors looking for short-term profits, harming long-term shareholders.
Today’s fund is an activist investor that looks to create long-term value for shareholders. The fund has successfully campaigned against Microsoft (MSFT), and generated billions in value for holders of the firm’s stock.
In addition to examining the portfolio, we’re including a deeper look into the fund’s largest current holding, providing you with the current Uniform Accounting Performance and Valuation Tearsheet for that company.
Investor Essentials Daily:
Friday Uniform Portfolio Analytics
Powered by Valens Research
We were recently on the phone with one of our institutional investor clients discussing work he was doing as a board member of a public company. The company was currently dealing with an activist investor.
All this activist wanted to talk about was initiatives to boost short-term EPS growth. To them, it seemed this was the only metric that had the market’s attention.
The investor client, who uses our Uniform Accounting data, knows how as-reported metrics are often detached from economic reality. An initiative to boost EPS may actually be damaging to the value of the company in the long run.
Activists, like the one our client is dealing with, often give activist investing a bad rap. There is the conception that activists are in it for short-term profits before getting out without improving the business.
However, there are some activist investors who look to truly improve the operations of a business in order to unlock shareholder value. These activists are highly regarded and often work in conjunction with management to improve a business.
One such activist fund is ValueAct Capital, a San-Francisco based hedge fund with around $10 billion in assets under management. The fund was started in 2000, by founder Jeff Ubben, who recently left to pursue a new socially responsible investing fund.
ValueAct looks to identify companies that have fallen out of favor or are undergoing a significant transition. The fund makes a large investment into the company before approaching management to make changes. ValueAct takes a long-term perspective on unlocking value and creating profits.
One of the firm’s most famous investments was Microsoft (MSFT) in 2013. ValueAct purchased $2 billion in stock and sought to get a spot on the board of directors. ValueAct proposed a stock buyback or a larger dividend payment to shareholders. The fund also sought for Microsoft to focus more on enterprise customers, rather than retail.
It is believed ValueAct was one of the main catalysts for the resignation of Steve Ballmer, who was eventually replaced by current CEO Satya Nadella. Since the 2013 activist campaign, Microsoft’s stock is up nearly 700%. This was a major change after nearly a decade of flat performance.
ValueAct’s Microsoft activist campaign highlights the potential long-term value of activist investors. When these funds look to make meaningful changes to improve operations, significant shareholder value can result.
We thought it would be instructive to look at ValueAct’s current holdings to see if we can glean any insight into the types of companies the firm looks for.
Taking a look at its holdings using as-reported accounting, it appears ValueAct is investing in low-return businesses. This would make sense considering its focus on turnaround situations or companies that have fallen out of favor of the market.
However, when applying the Uniform Accounting framework, we can see ValueAct is actually investing in a lot of high return businesses. It appears as though the firm is looking to bridge the gap between poor as-reported returners and the actual profitability of the business.
See for yourself below.
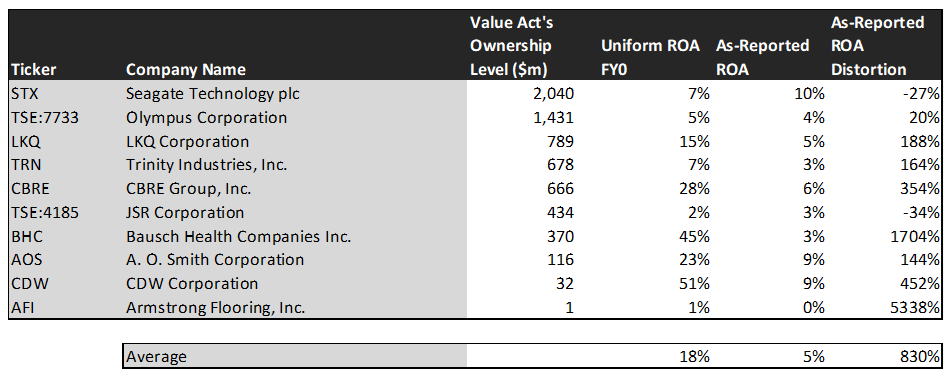
On an as-reported basis, many of these companies are poor performers with the average as-reported return on assets (ROA) right around 5% compared to corporate averages of 12%.
In reality, the average company in the index displays an impressive average Uniform ROA of 18%.
Once we make Uniform Accounting (UAFRS) adjustments to accurately calculate earnings power, we can see the underlying strength of the portfolio.
Once the distortions from as-reported accounting are removed, we can see Bausch Health (BHC) does not have a return of 3%, but a sizable ROA of 45%.
Similarly, CDW Corporation’s (CDW) ROA is really 51%, not at 9%. While as-reported metrics are portraying the company as a slightly above-average business, Uniform Accounting shows the company’s truly robust profitability.
The list goes on from there, for names ranging from CBRE Group (CBRE) and A.O. Smith (AOS), to LKQ Corporation (LKQ).
If investors were to only look at as-reported metrics, they would assume ValueAct is investing in average and low-quality businesses.
Now, let us see how these firms’ returns can strengthen over time through EPS growth.
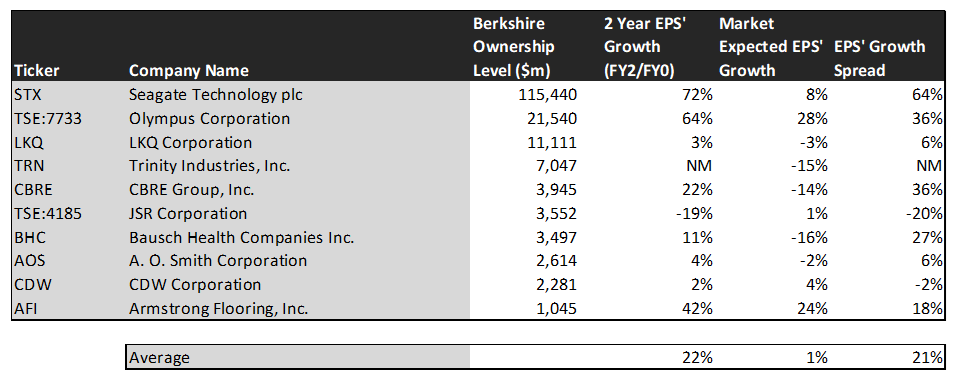
This chart shows three interesting data points:
- The 2-year Uniform EPS growth represents what Uniform earnings growth is forecast to be over the next two years. The EPS number used is the value of when we take consensus Wall Street estimates and we convert them to the Uniform Accounting framework.
- The market expected Uniform EPS growth is what the market thinks Uniform earnings growth is going to be for the next two years. Here, we show by how much the company needs to grow Uniform earnings in the next 2 years to justify the current stock price of the company. If you’ve been reading our daily analyses and reports for a while, you’ll be familiar with the term embedded expectations. This is the market’s embedded expectations for Uniform earnings growth.
- The Uniform EPS growth spread is the spread between how much the company’s Uniform earnings could grow if the Uniform earnings estimates are right, and what the market expects Uniform earnings growth to be.
The average company in the U.S. is forecast to have 5% annual Uniform Accounting earnings growth over the next 2 years. In comparison, these top stocks are forecasted similarly by analysts for 22% Uniform earnings growth.
On average, the market is pricing these companies to grow earnings by 1% a year. Analyst’s projections are far ahead of the market’s expectations.
One example of a company with high growth potential is Seagate Technology (STX). While the market expects Seagate to grow by just 8% over the next two years, analysts forecast the firm to see 72% growth over the same period.
Another example is CBRE Group. The company is cheap, as it is priced for Uniform earnings to shrink by 14%, but the company is forecasted to in fact grow its EPS by 22% in the next two years.
That being said, there are some companies forecast to have earnings growth less than market expectations. For these companies, like JSR Corporation (TSE:4185) and CDW Corporation, the market has growth expectations in excess of analysts’ predictions.
When looking at ValueAct’s holdings through the lens of Uniform Accounting, we can see the strength of their picks. It is clear the firm is identifying companies with weak as-reported metrics, but strong real returns. ValueAct has successfully used this strategy to unlock shareholder value in the past and appears to be continuing to do so.
SUMMARY and Seagate Technology Tearsheet
As ValueAct’s largest individual stock holdings, we’re highlighting Seagate Technology’s (STX:USA) tearsheet today.
As the Uniform Accounting tearsheet for Seagate highlights, their Uniform P/E trades at 19.7x, which is below global average valuation levels and historical average valuations.
Low P/Es require low, and even negative, EPS growth to sustain them. In the case of Seagate, the company has recently shown a 280% Uniform EPS growth.
Wall Street analysts provide stock and valuation recommendations that in general provide very poor guidance or insight. However, Wall Street analysts’ near-term earnings forecasts tend to have relevant information.
We take Wall Street forecasts for GAAP earnings and convert them to Uniform earnings forecasts. When we do this, Seagate’s Wall Street analyst-driven forecast is an immaterial Uniform EPS contraction in 2021 and a growth of 26% in 2022.
Based on current stock market valuations, we can use earnings growth valuation metrics to back into the required growth rate to justify Seagate’s $62 stock price. These are often referred to as market embedded expectations.
The company can have Uniform earnings shrink by 1% over the next three years and still justify current price levels. What Wall Street analysts expect for Seagate’s earnings growth is slightly above what the current stock market valuation requires in 2020, and well above that requirement in 2021.
Furthermore, the company’s earning power is around corporate average levels. Also, cash flows slightly but consistently exceed total obligations. That said, intrinsic credit risk is 150bps above the risk free rate. Together, these signal a moderate credit risk and low dividend risk.
To conclude, Seagate’s Uniform earnings growth is above peer averages, but the company is trading below peer average valuations.
Best regards,
Joel Litman & Rob Spivey
Chief Investment Strategist &
Director of Research
at Valens Research


