
This asset manager made a name for himself by understanding Economic Moats, don’t trust what as-reported metrics say about his success

While investors often focus on the financials, the real secret to understanding a company’s performance is to identify the metrics that can signal a company’s financial performance ahead of time.
One sure way to be able to do this is to identify the company’s type of business and understand if a company has a sustainable competitive advantage that allows it to generate high returns. Today’s fund has made this its philosophy and invested in a highly concentrated portfolio by using indicators to identify economic moats.
In addition to examining the portfolio, we are including a deeper look into the fund’s largest current holding, providing you with the current Uniform Accounting Performance and Valuation Tearsheet for that company.
Investor Essentials Daily:
Friday Uniform Portfolio Analytics
Powered by Valens Research
In macro investing, people often talk about the idea of leading versus lagging indicators. Leading indicators are metrics that help predict where the economy is headed. Leading indicators are metrics such as manufacturing activity, building permits, and consumer surveys. These data points can give insight into how the economy may perform months before anything occurs.
Lagging indicators are financial signals that are only apparent after large shifts have already taken place in the economy. They are most often used to confirm certain trends have occurred. Metrics like Consumer Price Index (CPI), trade balances, and average duration of unemployment.
Both leading and lagging indicators have value in different applications. Leading indicators help investors and policymakers determine if they need to change plans because of a shift in the economy. Lagging indicators help confirm when a move has actually happened, enabling the documentation and studying of fundamental changes.
In the same way economists use these indicators with the markets, investors can look for leading and lagging measures with individual companies.
Accounting data is often considered a lagging indicator. The financial statements are a look at the past performance and assets and liabilities of a company. Accounting information comes out after a quarter has already ended. It also is an “outcome” of the success or failure of corporate actions.
This means smart investors look beyond just the accounting data when analyzing companies. They often look at Key Performance Indicators (KPI) or quantitative non-financial information. These can often be thought of as leading indicators, they signal inflections in corporate performance before it shows up in the financials.
KPIs include things like foot traffic in stores, store sales growth, or even things like website traffic volumes. These metrics can often be calculated before a company reports its quarterly or annual results. If an investor knows that website volume has increased during a period, it can lead to insights into the future results of a company and its strategy.
KPIs can be used to pick out market trends to invest in. In the long term, this non-financial data can also be used to pick out a company’s advantages in its space as well. Understanding a company’s business strategy, and therefore the potential resiliency of its economic moat is powerful in forecasting future cash flows.
One investor that has built his career on the idea of understanding business strategies and economic moats is Pat Dorsey of Dorsey Asset Management. Dorsey spent the majority of his career at Morningstar (MORN) as the Director of Equity Research.
At Morningstar, he helped pioneer the fund’s economic moat ratings and the codifying of a company’s competitive advantages. Dorsey helped identify five sources of moats: switching costs, network effects, intangible assets, cost advantage, and efficient scale.
Switching costs refer to obstacles preventing customers from changing products, while network effects are the increased value of a good or service when more customers utilize it. Intangible assets refer to patents, brand identity, or government licenses. Cost advantages mean the ability to produce at lower costs and efficient scale is when companies benefit from a market with limited competitors.
These five sources of moat are the basis of what Dorsey has built Dorsey Asset Management on. He believes possessing a sustainable moat can insulate high-returning companies from competition.
Despite Dorsey’s focus on buying companies with strong economic moats, looking at the portfolio of Dorsey Asset Management paints a different picture. Using as-reported metrics, it appears that Dorsey is investing in low-return companies that have not been able to sustain any competitive advantages.
However, these securities are actually much stronger names once Uniform Accounting metrics are applied.
See for yourself below.
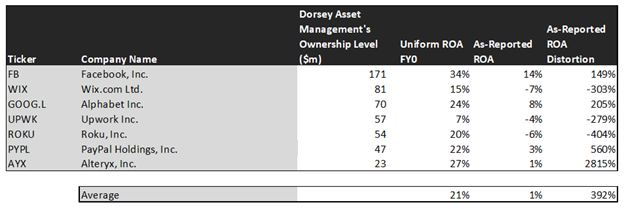
Using as-reported accounting, investors would think Dorsey is investing in low-return businesses with minimal economic moats. Dorsey runs a highly concentrated portfolio, invested in a select few companies.
On an as-reported basis, many of these companies are poor performers with returns at 0% or below, with the average as-reported return on assets (ROA) right around 1%.
In reality, the average company in the index displays an impressive average Uniform ROA of 21%.
Once we make Uniform Accounting (UAFRS) adjustments to accurately calculate earnings power, we can see the underlying strength of the portfolio.
Once the distortions from as-reported accounting are removed, we can see Alteryx (AYX) does not have a return of 1%, but a sizable ROA of 27%.
Similarly, Roku’s (ROKU) ROA is really 20%, not at -6%. While as-reported metrics are portraying the company as a negative return business, Uniform Accounting shows the company’s truly robust operations.
Wix.com (WIX) is another great example of as-reported metrics misrepresenting the company’s profitability. It doesn’t have a -7% ROA, it is actually at 15%.
The list goes on from there, for names ranging from Alphabet (GOOGL) and PayPal (PYPL), to Facebook (FB), and Upwork (UPWK).
If investors were to only look at as-reported metrics, they would assume Dorsey is ignoring his own strategy of buying companies with economic moats. In reality, these large companies have huge returns to justify their valuations.
Now, let us see how these firms’ returns can strengthen over time through EPS growth.
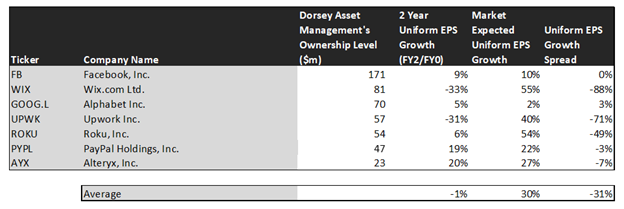
This chart shows three interesting data points:
- The 2-year Uniform EPS growth represents what Uniform earnings growth is forecast to be over the next two years. The EPS number used is the value of when we take consensus Wall Street estimates and we convert them to the Uniform Accounting framework.
- The market expected Uniform EPS growth is what the market thinks Uniform earnings growth is going to be for the next two years. Here, we show by how much the company needs to grow Uniform earnings in the next 2 years to justify the current stock price of the company. If you’ve been reading our daily analyses and reports for a while, you’ll be familiar with the term embedded expectations. This is the market’s embedded expectations for Uniform earnings growth.
- The Uniform EPS growth spread is the spread between how much the company’s Uniform earnings could grow if the Uniform earnings estimates are right, and what the market expects Uniform earnings growth to be.
The average company in the U.S. is forecast to have 5% annual Uniform Accounting earnings growth over the next 2 years. On the other hand, these top stocks are forecasted by analysts for a 1% Uniform earnings shrinkage.
On average, the market is pricing these companies to grow earnings by 30% a year. This highlights that by buying these companies with competitive advantages, Dorsey is often buying into firms that already have high market expectations.
The only firm with growth expectations ahead of the market is Alphabet. While the market expects Alphabet to grow by 2% over the next two years, analysts forecast the firm to see a 5% growth over the same period.
There are however many companies in the portfolio that are forecast to have earnings growth less than market expectations. Roku is forecast to grow earnings by 6%, while the market expectations are a much more robust 54%.
Other companies with higher market expectations than analyst forecasts include Wix.com, PayPal, and Alteryx.
For these firms, it is clear Dorsey is betting the competitive moats these companies can have in strong growth markets, meaning they can deliver stronger growth than analysts are forecasting and satisfy the market’s high expectations.
While the jury may be out on if Dorsey’s stocks can sustain the growth they need to, it is clear using Uniform Accounting that the fund is investing in companies with high economic moats.
As long as Dorsey is right that those moats can be resilient and the high growth markets his investments are in stay strong, he could be proven right even with market expectations being so high. That being said, not even this question would be apparent if looking at the company’s as-reported metrics that significantly understate the company’s performance.
SUMMARY and Facebook, Inc. Tearsheet
As Dorsey Asset Management’s largest individual stock holding, we’re highlighting Facebook’s tearsheet today.
As the Uniform Accounting tearsheet for Facebook highlights, the Uniform P/E trades at 27.7x, which is above corporate average valuation levels and its historical average valuations.
High P/Es require high EPS growth to sustain them. In the case of Facebook, the company has recently shown a 2% Uniform EPS growth.
Wall Street analysts provide stock and valuation recommendations that in general provide very poor guidance or insight. However, Wall Street analysts’ near-term earnings forecasts tend to have relevant information.
We take Wall Street forecasts for GAAP earnings and convert them to Uniform earnings forecasts. When we do this, Facebook’s Wall Street analyst-driven forecast is a 3% growth into 2020 and a 16% growth into 2021.
Based on current stock market valuations, we can use earnings growth valuation metrics to back into the required growth rate to justify Facebook’s $253 stock price. These are often referred to as market embedded expectations.
The company needs to grow its Uniform earnings by 10% each year over the next three years and to justify current stock prices. What Wall Street analysts expect for Facebook’s earnings growth is below what the current stock market valuation requires in 2020 but above in 2021.
Furthermore, the company’s earning power is 6x the corporate average. Also, cash flows are 5x above their total obligations—including debt maturities, capex maintenance, and dividends. Together, this signals a low credit and dividend risk.
To conclude, Facebook’s Uniform earnings growth is above peer averages in 2020. However, the company is trading below average peer valuations.
Best regards,
Joel Litman & Rob Spivey
Chief Investment Strategist &
Director of Research
at Valens Research