
This Company Is a Prime Example of Incentives Dictating Behavior

Google at the time, Alphabet (GOOGL) now, was a great success on our Conviction Long Idea list from 2013 to 2019, when it was up almost 140%.
While we were recommending the company in 2013, we became exceptionally bullish on the company in 2015 when something important happened.
Ruth Porat joined the company as CFO, coming from Morgan Stanley.
Part of her mandate when she joined was to rationalize Google’s moonshot initiatives. Her compensation was focused on keeping Google growing, but maintaining profitability.
These were and are initiatives Google invests in across various fields, attempting to invent another world-beating product, similar to their core legacy search advertising business. Google had consistently grown their asset by 20%+ a year over the prior 10 years through these investments.
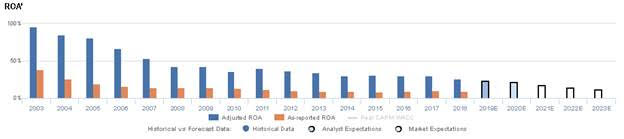
For Google to sustain its growth, it was vital they continue to invest in innovation. But the problem was, those growth investments had led Uniform ROA for Google to drop from 96% in 2003 to 30% in 2014. Google was plowing money into lower return businesses.
The market could see the trend, and assumed this trend would continue. Google was priced for Uniform ROA to continue to drop going forward.
Porat came in and pushed the engineers at Google that they should keep on researching moonshots, but they should do so thoughtfully. If projects could realistically yield real cash flows in the future, then they should keep on investing. But if not, those projects needed to stop.
While the market was expecting returns to decline, her focus, thanks to her compensation alignment, helped change the company’s culture.
Over the next 4 years, from 2014 to 2019, Uniform ROA stabilized at 30% a year, even as the company kept growing at 20% or more a year, and the market reacted. The stock doubled from $600 to over $1,300 currently.
In 2018 and into the first half of 2019, the stock paused its ascent. The reason was because cost pressures were starting to emerge again. With regulatory pressure leading to more needed investment, margins came under pressure. This led to returns declining, and the market started to be spooked that Porat’s magic was running out.
But in the Q3 2019 earnings calls, management started to show more confidence about their outlook for the business, including cash flow trends, and their ability to drive growth and innovate. With the market expecting returns to continue to roll over, as they did from 2017-2018, if the company can sustain growth and maintain cash flow profitability, then there could be more upside for Google going forward.
Market expectations are for Uniform ROA to continue declining, but management is confident about their products, revenue growth, and cash flow

GOOGL currently trades near corporate averages relative to UAFRS-based (Uniform) Earnings, with a 19.5x Uniform P/E. At these levels, the market is pricing in expectations for Uniform ROA to fade from 26% in 2018 to a historical low of 11% by 2023, accompanied by 22% Uniform Asset growth going forward.
However, analysts have less bearish expectations, projecting Uniform ROA to only decline slightly to 21% by 2020, accompanied by 22% Uniform Asset growth.
GOOGL had seen fairly steady declines in Uniform ROA over the last 15 years, as the firm has aggressively invested to grow their business and cash flow streams. In its early stages (prior to 2006), the firm generated Uniform ROA north of 96%, but after growing its Uniform Asset base by 50%+ each year through 2008, they saw returns diminish, with Uniform ROA falling to 36% in 2010. Since then, although the firm has slowed Uniform Asset growth, it continues to grow in excess of 20% each year.
Even with the company’s continued investment in growth, since 2014, Uniform ROA stabilized around 30% levels before falling to 26% in 2018. This has been driven by a renewed focus in profitability investment, as the current CFO, Ruth Porat, has sought to enable the company to grow.
Performance Drivers – Sales, Margins, and Turns

Declines in Uniform ROA have been driven by fading Uniform Asset Turns, while Uniform Earnings Margin has remained largely stable. While Uniform Margins have been mostly consistent, they rose from 27% in 2003 to 32% in 2006, and ranged from 27%-31% through 2018. Meanwhile, Uniform Turns have fallen significantly as the firm has invested in its asset base, from 3.6x in 2003 to just 1.0x in 2018. At current valuations, markets appear to be pricing in expectations for continued slight Uniform Turns compression along with a downturn in Uniform Margins.
Earnings Call Forensics
Valens’ qualitative analysis of the firm’s Q3 2019 earnings call highlights that management is confident their strong revenue growth was driven by mobile search, and they are confident their new Pixelbook Go provides premium features at a more affordable price point. Furthermore, they are confident their Discover product adds value to users and that their operating cash flow was $15.5 billion. Finally, they are confident their TAC improved due to growth in TAC free channels such as YouTube.
However, management may lack confidence in their ability to sustain YouTube premium growth internationally, and they may be concerned about the extent to which they have optimized their machine learning powered advertising tools. Additionally, they may be concerned about the profitability of their subscription products, and they may be overstating the benefit customers realize from their BigQuery product.
UAFRS VS As-Reported
Uniform Accounting metrics also highlight a significantly different fundamental picture for GOOGL than as-reported metrics reflect. As-reported metrics can lead investors to view a company to be dramatically stronger or weaker than real operating fundamentals highlight. Understanding where these distortions occur can help explain why market expectations for the company may be divergent.
As-reported metrics significantly understate GOOGL’s profitability. For example, as-reported ROA for GOOGL was 9% in 2018, well below Uniform ROA of 26%, making GOOGL appear to be a much weaker business than real economic metrics highlight. Moreover, since inception, as-reported ROA has been less than half of Uniform ROA, distorting the market’s perception of the firm’s historical profitability.
Today’s Tearsheet
Today’s tearsheet is for PayPal Holdings. PayPal trades above market average valuations. The company has recently had 26% Uniform EPS growth. EPS growth is forecast to remain strong, at 15% in 2019, and 10% in 2020. At current valuations, the market is pricing the company to see earnings grow by 21% a year going forward
The company’s earnings growth is forecast to be above peers in 2019, but company is also trading above peer average valuations. The company has robust returns, and no cash flow risk.
Regards,
Joel Litman
Chief Investment Strategist


