
This company is benefitting from how the At-Home Revolution is fueling home improvement, contrary to what as-reported metrics say

As a supplier of all-things home improvement, today’s company is well positioned to be a winner of the “At-Home Revolution.”
As-reported metrics would have you believe that this company has returns only slightly above cost-of-capital but true UAFRS (Uniform) based analysis shows the firm’s real profitability.
Also below, Uniform Accounting Embedded Expectations Analysis and the Uniform Accounting Performance and Valuation Tearsheet for the company.
Investor Essentials Daily:
Thursday Tearsheets
Powered by Valens Research
If you are a daily reader of ours, you know that the “At-Home Revolution” is upon us. Because of the coronavirus, people are spending more time in their homes than ever before.
And with this shift towards more time at home, working, and playing, and doing everything in between, the companies supplying the revolution are bound to do well.
But it’s not just the companies that supply monitors, computers, software, TVs, and toys that are likely to see upside.
People sending more time at home means they are investing more in making their home more livable, not just more efficient for work and entertainment. There has been surging demand for home improvement.
Consumers’ have a renewed interest in investing in their homes as minor improvements to the functionality or appearance of a house have suddenly become vastly more important.
That’s where Fortune Brands Home & Security (FBHS) comes in.
As the owners of brands such as MasterLock, Moen, and MasterBrand, this is a company that sells top of the line products to consumers who are looking to make their homes both safer and more livable.
Whether its replacing dated cabinets, improving security systems, or updating plumbing, Fortune Brands Home & Security has consumers covered.
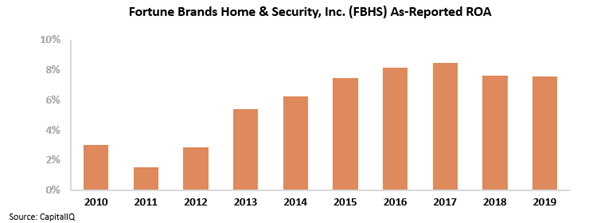
Despite owning such high-quality brands, when looking at its as-reported return on assets (ROA) it would appear that Fortune Brands is a struggling business with ROA narrowly above cost-of-capital levels at 8%.
But the reality is, Fortune Brands’ industry-leading brands provide best-in-class products across a wide range of home improvement offerings and they have been rewarded for it over the years.
Once we remove the GAAP distortions around line items such as goodwill, Fortune Brands’ true profitability becomes clear.
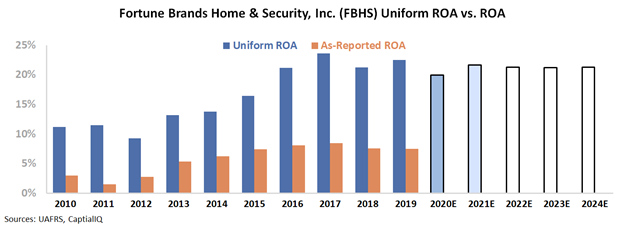
The firm has seen impressive returns, well above corporate averages, with Uniform ROA comfortably around 20% for the past five years.
This looks like the return investors should expect for a company with such high quality brands. And it appears the market recognizes this, expecting returns to remain flat around 21% going forward.
While some investors may be blind-sided on why Fortune Brands trades at a premium valuation, investors who look at the real numbers realize the firm is not a commodity business and it justifies premium valuations.
With the fundamental tailwinds that the At-Home Revolution is offering to home improvement suppliers, market expectations for sustained strong returns makes sense.
Fortune Brands Home & Security, Inc. Embedded Expectations Analysis – Market expectations are for Uniform ROA to decline, and management may be concerned about growth, the housing market, and margins
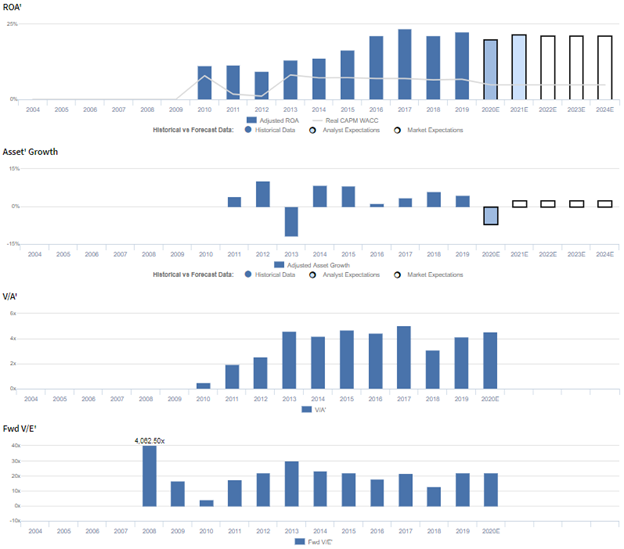
FBHS currently trades below corporate averages relative to Uniform earnings, with a 22.1x Uniform P/E (Fwd V/E′). At these levels, the market is pricing in expectations for Uniform ROA to decline from 23% in 2019 to 21% in 2024, accompanied by 3% Uniform asset growth going forward.
Meanwhile, analysts have less bearish expectations, projecting Uniform ROA to remain at 22% levels through 2021, accompanied by 7% Uniform asset contraction.
Following its spin-off from Fortune Brands in 2010, FBHS has seen robust and generally improving profitability. After expanding from 11%-12% levels in 2010-2011 to a peak of 24% in 2017, Uniform ROA fell slightly to 22% in 2019.
Meanwhile, Uniform asset growth has been fairly muted, positive in eight of the past nine years, while ranging from -12% to 10%.
Performance Drivers – Sales, Margins, and Turns
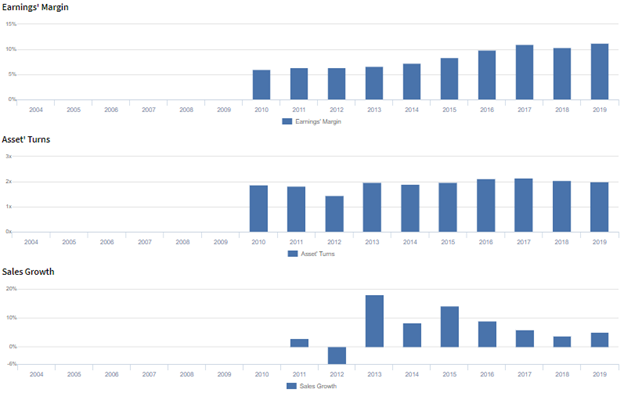
Improvements in Uniform ROA have been driven by improvements in Uniform earnings margins, coupled with stability in Uniform asset turns.
Uniform margins have steadily improved from 6% lows in 2010-2012 to 10%-11% in 2016-2019. Meanwhile, Uniform turns fell briefly from 1.9x in 2010 to 1.4x in 2012, before improving to and stabilizing at 1.9x-2.1x levels through 2019.
At current valuations, markets are pricing in expectations for a reversal of recent improvements in Uniform margins, coupled with further stability in Uniform turns.
Earnings Call Forensics
Valens’ qualitative analysis of the firm’s Q4 2019 earnings call highlights that management may be overstating Global Plumbing Group’s ability to remain an industry leader and the sustainability of U.S. new construction and housing market growth.
In addition, they may lack confidence in their ability to build brand awareness among millennial-aged adults, sustain Cabinet store sales growth, and pursue the most profitable growth opportunities.
Furthermore, management may have concerns about their Moen China operations and a slow housing market in Canada and Mexico.
Moreover, they may lack confidence in their ability to improve their EPS, sustain growth in China and in their decking and security businesses, and maintain their operating income, operating margins, and free cash flow.
Additionally, management may be concerned about the sustainability of growth across their product markets, their capacity realignment, and potential increases in M&A activity.
Finally, they may lack confidence in their ability to cut costs and expand and optimize their Mexican manufacturing footprint, and they may be overstating Door construction tailwinds for 2020.
UAFRS VS As-Reported

Uniform Accounting metrics also highlight a significantly different fundamental picture for FBHS than as-reported metrics reflect.
As-reported metrics can lead investors to view a company to be dramatically stronger or weaker than real operating fundamentals highlight. Understanding where these distortions occur can help explain why market expectations for the company may be divergent.
As-reported metrics significantly understate FBHS’s profitability. For example, as-reported ROA for FBHS was just 8% in 2019, materially lower than Uniform ROA of 23%, making FBHS appear to be a much weaker business than real economic metrics highlight.
Moreover, as-reported ROA has never eclipsed 9% since inception, while Uniform ROA has never fallen below 9% over the same timeframe, distorting the market’s perception of the firm’s profitability ceiling.
SUMMARY and Fortune Brands Home & Security, Inc. Tearsheet
As the Uniform Accounting tearsheet for Fortune Brands Home & Security, Inc. (FBHS:USA) highlights, the Uniform P/E trades at 22.1x, which is in line with corporate average valuation levels and its own recent history.
Average P/Es require average EPS growth to sustain them. In the case of Fortune Brands, the company has recently shown a 15% growth in Uniform EPS.
Wall Street analysts provide stock and valuation recommendations that in general provide very poor guidance or insight. However, Wall Street analysts’ near-term earnings forecasts tend to have relevant information.
We take Wall Street forecasts for GAAP earnings and convert them to Uniform earnings forecasts. When we do this, Fortune Brands’ Wall Street analyst-driven forecast is a 18% shrinkage in 2020, followed by an 15% growth in 2021.
Based on the current stock market valuations, we can use earnings growth valuation metrics to back into the required growth rate to justify Fortune Brands’ $69 stock price. These are often referred to as market embedded expectations.
The company only needs minimal growth in Uniform earnings each year over the next three years to justify current prices. What Wall Street analysts expect for Fortune Brands’ earnings growth is above what the current stock market valuation requires in 2021.
Furthermore, the company’s earning power is 4x the corporate average. Additionally, cash flows are above their total obligations—including debt maturities, capex maintenance, and dividends. Together, this signals low risk for their dividend.
To conclude, Fortune Brands’ Uniform earnings growth is below peer averages, therefore, as is warranted, the company is also trading below average peer valuations.
Best regards,
Joel Litman & Rob Spivey
Chief Investment Strategist &
Director of Research
at Valens Research