
This contacts maker could see a surge in demand, and investors only realize why that matters when looking through the right, UAFRS lens

With the proliferation of masks, glasses wearers around the world have wondered if it is time to switch to contacts. Today’s company is well positioned to ride this consumer shift through its ownership of multiple contact lens brands.
As-reported metrics would have you believe this company’s returns are well below corporate averages, but true UAFRS (Uniform) based analysis shows the firm’s real profitability.
Also below, Uniform Accounting Embedded Expectations Analysis and the Uniform Accounting Performance and Valuation Tearsheet for the company.
Investor Essentials Daily:
Tuesday Tearsheets
Powered by Valens Research
The pandemic and stay-at-home orders have been far-reaching in their effects. Some of the alterations have been dramatic, while others only cosmetic.
Widespread working from home has been one of the most drastic changes. Another major change has been a lack of travel. Many Americans had to cancel business trips, summer vacations overseas, and students had to call off study abroad programs. Instead, people have taken part in more staycations.
Furthermore, there has been an exodus from the cities to more suburban areas. The pandemic has made many of the amenities of cities less relevant.
Many people had opted to live in cities for the abundance of museums, theaters, restaurants, and people to interact with. With coronavirus restrictions and social distancing, taking advantage of these amenities is now impossible. In response to the changes, many people have taken the leap to suburban life because of the open space and parks.
There have also been smaller changes, like an increase in the number of times people wash their hands. People also have adapted to changes by going on walks more often or baking more than in the past.
Another lifestyle change is wearing masks. In many parts of the Western world, it is no longer phone, wallet, keys, it is now phone, wallet, keys, and mask.
While masks have many positives, one negative is their ability to fog up glasses. Over 60% of the American population is visually impaired in some way, and many of those people wear glasses. For these people, it can be frustrating to have glasses fog up and cloud visibility every time they laugh or breath heavily.
Given that masks are needed most times when leaving the house, this small annoyance may push people who wear glasses to switch to contacts. This could lead to increased demand for contacts once people are comfortable with going into their eye doctor’s office again.
According to a Centers for Disease Control and Prevention (CDC) study, those who switch to contact lenses report significant improvements to self-esteem and perceived appearance, indicating that once people make the switch to contacts, they may be unlikely to go back.
One possible benefactor of this increased demand is Cooper Companies (COO). Cooper owns many contacts brands, including Biofinity, Clariti 1 Day, MyDay, and Avaira Vitality.
With so many different contact lens brands, Cooper looks well-positioned to take advantage of increased demand.
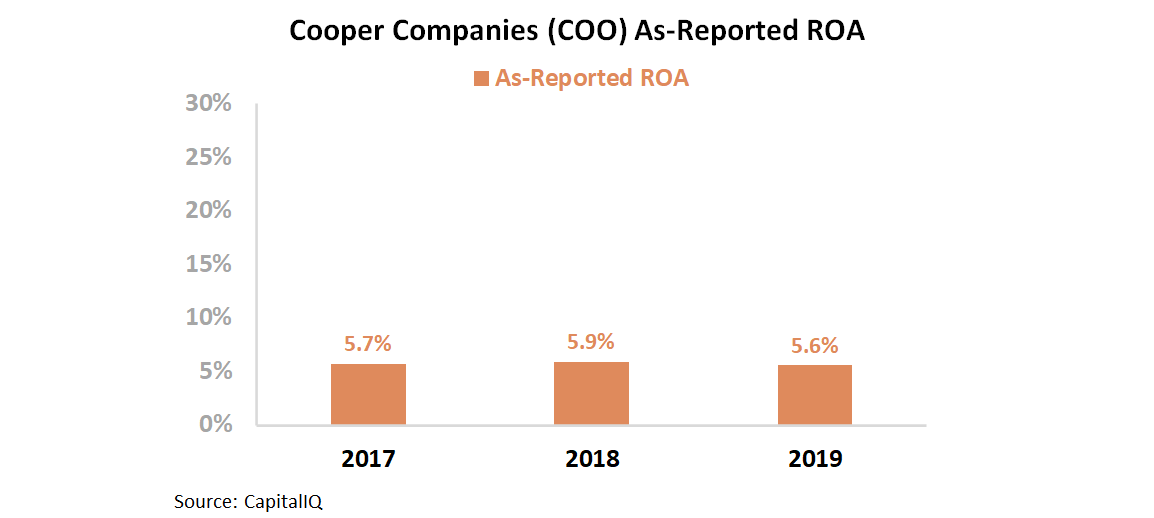
However, looking at as-reported metrics, it appears Cooper has muted profitability. Over the past three years, as-reported return on assets (ROA) has stayed at 6%. This is well below corporate averages and slightly above cost-of-capital levels.
Nonetheless, this picture of Cooper is not accurate. This is due to GAAP accounting and the treatment of goodwill and intangibles, among other distortions.
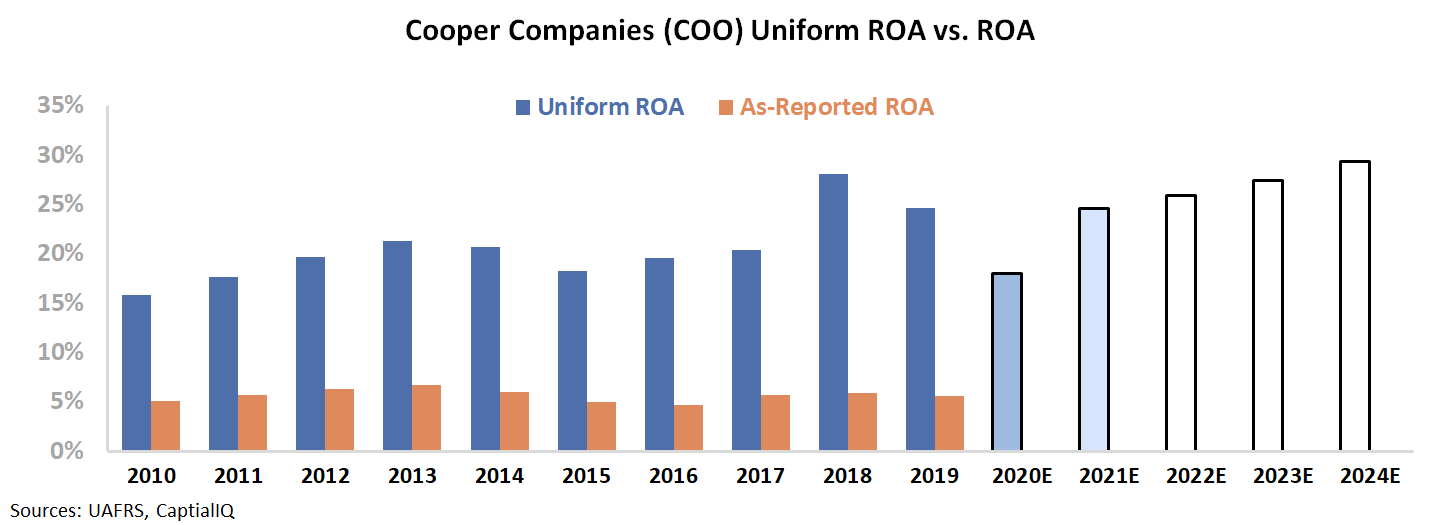
In reality, Cooper has strong profitability. Over the past three years, Uniform ROA has ranged between 20% and 28%.

Uniform Accounting is able to show Cooper is more profitable than as-reported metrics imply. Furthermore, this makes the possible increase in demand much more attractive. If Cooper sees a surge in sales, that’s compounding a high-return business, not a low return one.
However, to understand the stock price, we must look at expectations. To evaluate the market’s assumptions for the firm, we can use the Embedded Expectations Framework.
The chart below explains the company’s historical corporate performance levels, in terms of ROA (dark blue bars) versus what sell-side analysts think the company is going to do in the next two years (light blue bars) and what the market is pricing in at current valuations (white bars).
The below graph shows sell-side analysts expect ROA to dip this year before returning to 25% in 2021. Then, the market is pricing in ROA to reach an all-time high of 29% by 2024.
While this would be a significant ROA recovery from 2020, it is only 1% higher than 2018’s levels. Tailwinds from increased contact use due to masks may be able to propel ROA to 29%.
Uniform Accounting is able to show that looking at a company through the correct lens makes all the difference. The market may believe Cooper is much less profitable than it truly is.
However, Uniform ROA portrays a firm with robust profitability. Moreover, while the market is pricing in further improvement, increased demand for contacts may be able to aid the company.
Without Uniform Accounting, investors may be blind to an exciting company with a powerful growth story.
The Cooper Companies, Inc. Embedded Expectations Analysis – Market expectations are for Uniform ROA to improve, but management may be concerned about MiSight sales, pricing, and product launches
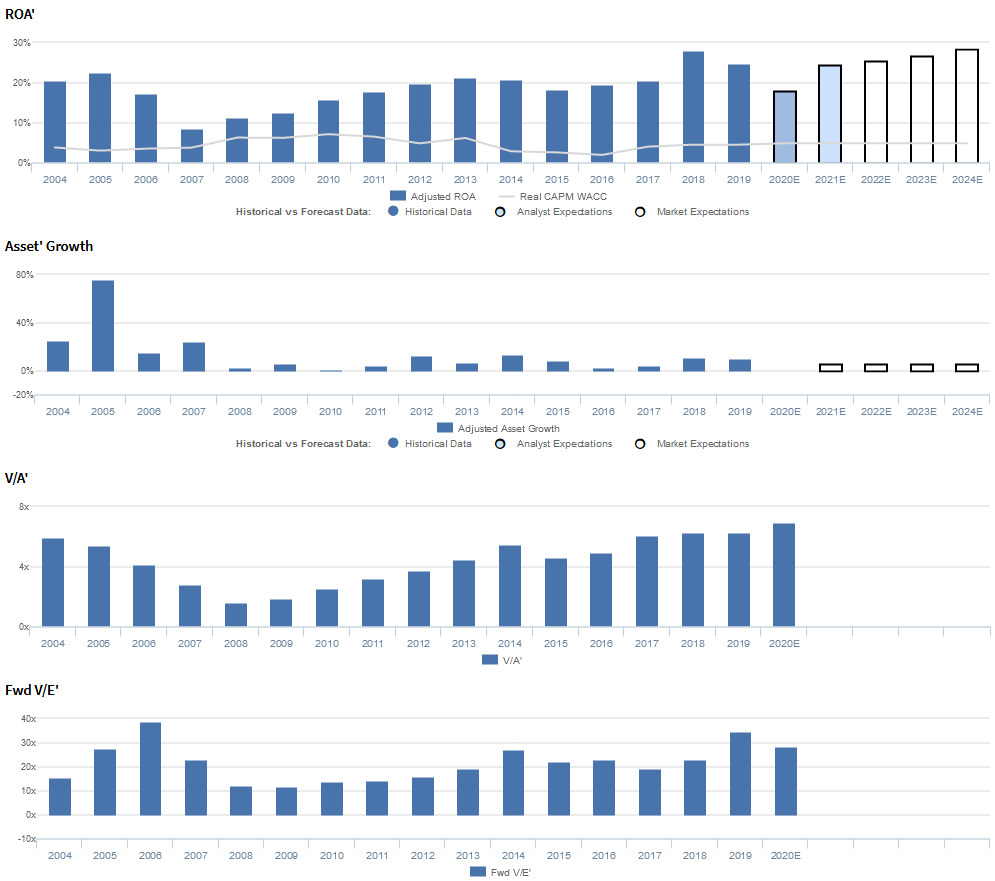
COO is currently trading above recent averages relative to Uniform earnings, with a 28.5x Uniform P/E (Fwd V/E′). At these levels, the market is pricing in expectations for Uniform ROA to improve from 25% in 2019 to 29% in 2024, accompanied by 6% Uniform asset growth going forward.
Meanwhile, analysts have less bullish expectations, projecting Uniform ROA to maintain 25% levels through 2021, accompanied by immaterial Uniform asset growth.
Historically, COO has seen robust, yet volatile profitability. After falling from 21%-23% levels in 2004-2005 to a low of 9% in 2007, Uniform ROA slowly recovered to 21% in 2013 before fading to 18% in 2015. Then, after jumping to a peak of 28% in 2018, Uniform ROA faded to 25% in 2019.
Meanwhile, Uniform asset growth has been consistently positive in each year since 2004, while ranging from 1%-25%, excluding 76% growth in 2005 due to the acquisition of Ocular Science.
Performance Drivers – Sales, Margins, and Turns
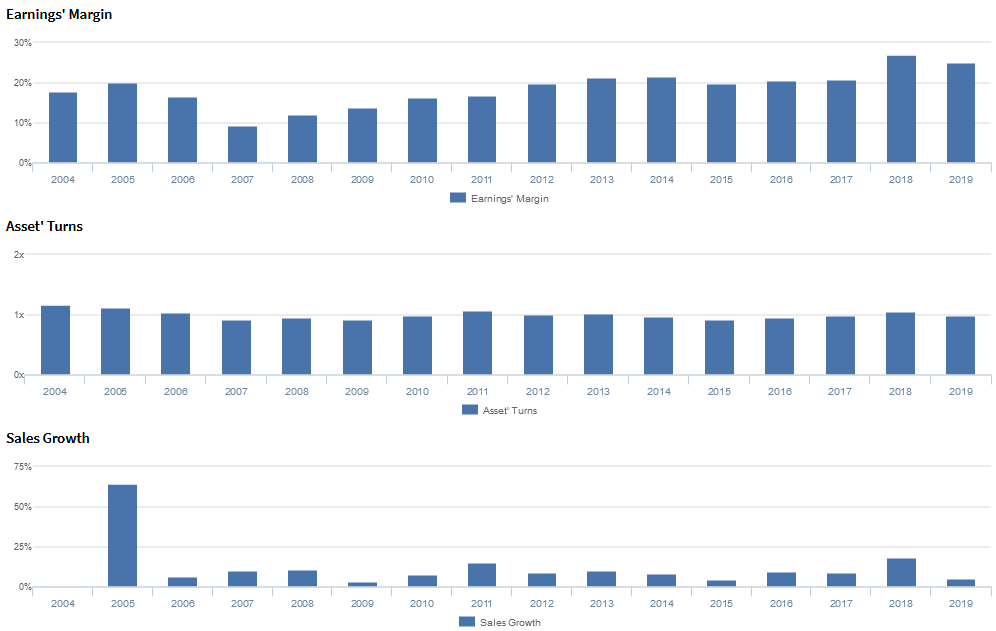
Trends in Uniform ROA have been driven primarily by trends in Uniform earnings margins and to a lesser extent, Uniform asset turns.
After contracting from 18%-20% levels in 2004-2005 to a low of 9% in 2007, Uniform margins gradually recovered to 20%-21% levels from 2012-2017. Then, after jumping to a high of 27% in 2018, Uniform margins faded to 25% in 2019.
Meanwhile, Uniform turns declined from 1.2x in 2004 to 0.9x levels in 2007-2009, before rebounding to 1.0x levels from 2012-2019, excluding slight 0.9x underperformance in 2015.
At current valuations, the market is pricing in expectations for Uniform margins to rebound to a new peak, accompanied by continued stability in Uniform turns.
Earnings Call Forensics
Valens’ qualitative analysis of the firm’s Q1 2020 earnings call highlights that management is confident there is plenty of demand for MyDay lenses and that the optometrists that attended their training program are now certified to sell MiSight lenses.
However, they may have concerns about MyDay lens capacity constraints, the ability of the EMEA region to recover, and the sales impact of coronavirus, namely in South Korea. In addition, they may lack confidence in their ability to sustain CooperVision gross margin and MiSight sales growth, and mitigate declines in their legacy hydrogel business.
Furthermore, they may be concerned about pricing pressures from product rerouting and rebates for new and existing wearers, and they may be exaggerating the growing interest for their other products. Finally, they may lack confidence in their ability to execute their DT1 Toric launch, develop a multifocal product, and meet PARAGARD sales and marketing spend guidance.
UAFRS VS As-Reported

Uniform Accounting metrics also highlight a significantly different fundamental picture for COO than as-reported metrics reflect.
As-reported metrics can lead investors to view a company to be dramatically stronger or weaker than real operating fundamentals highlight. Understanding where these distortions occur can help explain why market expectations for the company may be divergent.
As-reported metrics significantly understate COO’s profitability. For example, as-reported ROA for COO was 6% in 2019, materially lower than Uniform ROA of 25%, making COO appear to be a much weaker business than real economic metrics highlight.
Moreover, since 2010, as-reported ROA has remained at 5%-7% levels through 2019, while Uniform ROA has expanded from 16% to 25% over the same time frame, directionally distorting the market’s perception of the firm’s profitability trends for a decade.
SUMMARY and The Cooper Companies, Inc. Tearsheet
As the Uniform Accounting tearsheet for The Cooper Companies, Inc. (COO:USA) highlights, its Uniform P/E trades at 28.5x, which is above global corporate average valuation levels and its historical average valuations.
High P/Es require high EPS growth to sustain them. In the case of Cooper, the company has recently shown a 1% Uniform EPS decline.
Wall Street analysts provide stock and valuation recommendations that in general provide very poor guidance or insight. However, Wall Street analysts’ near-term earnings forecasts tend to have relevant information.
We take Wall Street forecasts for GAAP earnings and convert them to Uniform earnings forecasts. When we do this, Cooper’s Wall Street analyst-driven forecast an EPS decline of 29% in 2020, followed by an EPS growth of 56% in 2021.
Based on the current stock market valuations, we can use earnings growth valuation metrics to back into the required growth rate to justify Cooper’s $335 stock price. These are often referred to as market embedded expectations.
In order to justify current stock prices, the company would need to have Uniform earnings grow by 8% per year over the next three years. What Wall Street analysts expect for Cooper’s earnings growth is below what the current stock market valuation requires in 2020 but above its requirement in 2021.
Furthermore, the company’s earning power is 4x the corporate average. That said, cash flows and cash on hand are below its total obligations—including debt maturities, capex maintenance, and dividends. Together, this signals high credit and dividend risk.
To conclude, Cooper’s Uniform earnings growth is above peer averages. However, the company is trading below peer values.
Best regards,
Joel Litman & Rob Spivey
Chief Investment Strategist &
Director of Research
at Valens Research


