
This fund has found success investing in emerging markets, and Uniform Accounting shows why

International markets have become great places for fund managers to look for alpha. Many emerging markets are less developed than the U.S. and have more growth potential.
Today’s fund is one of the most successful international managers of the last few years. It focuses on identifying high-quality and growing companies in international markets.
In addition to examining the portfolio, we are including a deeper look into the fund’s largest current holding, providing you with the current Uniform Accounting Performance and Valuation Tearsheet for that company.
Investor Essentials Daily:
Friday Uniform Portfolio Analytics
Powered by Valens Research
A large part of investing success comes from time in the market and getting asset allocation right. This is a concept we have talked about in a past IED about Jack Bogle.
He argued the biggest mistake investors make is failing to let capital accumulate over time. Investors get so bogged down in timing the market with individual stocks, they miss the big picture.
Choosing an individual stock can be less important when compared to overall investing strategy.
Bogle’s philosophy lines up with our own views in the Timetable Investor. It’s often more valuable to strike the right balance in cash, bonds, and equities in a portfolio.
Within the equity section, it’s important to have the right level of diversification. This prevents poor performance in one sector or market from tanking the whole portfolio.
With that being said, over 60% of a stock’s performance comes from its respective market. This means many investors, in an effort to diversify, focus on buying international exposure in addition to the U.S. markets.
By doing so, these investors argue they are removing some of the risks associated with buying only U.S. stocks.
What they don’t realize is they may already be indexing in international markets. Around 40% of sales for companies in the S&P 500 come from international revenue. The S&P 500 is already a diverse index.
The constituent companies are global and have large international revenue streams.
That said, by buying into the S&P 500, investors are still seeing a large correlation to U.S. markets. For the investor looking at complete international exposure, Goldman Sachs (GS) GQG Partners International Opportunities Fund may be the best option.
The fund invests in developed and emerging market opportunities. It uses a growth at a reasonable price (GARP) framework to select stock. The fund is focused on companies with sustainable long-term growth prospects and durable competitive advantages.
Since its inception in 2016, the fund has seen great returns. The International Opportunities Fund has returned 15% annually since its first day.
This is much higher than its benchmark, MSCI AWCI, which returns around 6% annually. The MSCI AWCI index represents thousands of stocks across international markets, excluding the U.S.
Goldman’s strategy of focusing on high-quality international compounders has clearly paid off.
However, using as-reported metrics, it appears Goldman is buying into low return companies with declining earnings. In addition, it’s impossible to directly compare U.S.-based GAAP profitability to international IFRS financial statements.
In truth, these securities are strong performers once Uniform Accounting metrics are universally applied across the portfolio.
See for yourself below.

On an as-reported basis, many of these companies are poor performers with returns at 10% or below, with the average as-reported return on assets (ROA) right around 9%.
In reality, the average company in the index displays an impressive average Uniform ROA of 39%.
Once we make Uniform Accounting (UAFRS) adjustments to accurately calculate earnings power, we can see the underlying strength of the portfolio.
Once the distortions from as-reported accounting are removed, we can see Alibaba (BABA) does not have a return of 5%, but a sizable ROA of 119%.
Similarly, Tencent’s (SEHK:700) ROA is really 124%, not at 7%. While as-reported metrics are portraying the company as a slightly above cost-of-capital business, Uniform Accounting shows the company’s profitability.
The list goes on from there, for names ranging from Mastercard (MA) and Visa (V), to Nintendo (TSE:7974) and NVIDIA (NVDA).
If investors were to only look at as-reported metrics, they would assume Goldman is investing in low-quality businesses.
Now, let us see how these firms’ returns can strengthen over time through EPS growth.
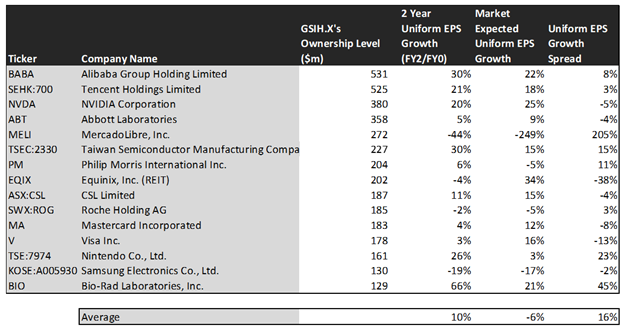
This chart shows three interesting data points:
- The 2-year Uniform EPS growth represents what Uniform earnings growth is forecast to be over the next two years. The EPS number used is the value of when we take consensus Wall Street estimates and we convert them to the Uniform Accounting framework.
- The market expected Uniform EPS growth is what the market thinks Uniform earnings growth is going to be for the next two years. Here, we show by how much the company needs to grow Uniform earnings in the next 2 years to justify the current stock price of the company. If you’ve been reading our daily analyses and reports for a while, you’ll be familiar with the term embedded expectations. This is the market’s embedded expectations for Uniform earnings growth.
- The Uniform EPS growth spread is the spread between how much the company’s Uniform earnings could grow if the Uniform earnings estimates are right, and what the market expects Uniform earnings growth to be.
The average company in the U.S. is forecast to have 5% annual Uniform Accounting earnings growth over the next 2 years. On the other hand, these top stocks are forecasted by analysts for 10% Uniform earnings growth.
On average, the market is pricing these companies to shrink earnings by 6% a year. This highlights how Goldman is focused on companies projected to grow earnings much faster than the market is pricing.
One example of a company with high growth potential is Nintendo. While the market expects Nintendo to grow by 3% over the next two years, analysts forecast the firm to see 26% growth over the same period.
Another company with similar dislocations is Bio-Rad Laboratories (BIO). The company is forecast for Uniform EPS to grow by 66% a year, and the market is expecting the company to only grow EPS by 21%.
Yet another example is Philip Morris International (PM). The company is cheap, as it is priced for Uniform earnings to shrink by 5%, but the company is forecast to in fact grow its EPS by 6% in the next two years.
That being said, there are some companies forecast to have earnings growth less than market expectations. For these companies, like Equinix (EQIX), Visa, and Abbott Laboratories (ABT), the market has growth expectations in excess of analysts’ predictions.
In conclusion, Goldman Sachs International Opportunities Fund is a great place to get further exposure to emerging markets. The largest companies in this fund possess high returns and growth projections above the market’s expectations once we remove the as-reported distortions.
It becomes clear that investing in international markets does not mean sacrificing high-quality businesses.
SUMMARY and Alibaba Group Incorporated Tearsheet
As GS GQG Partners International Opportunities Funds’ largest individual stock holding, we’re highlighting Alibaba Group’s tearsheet today.
As the Uniform Accounting tearsheet for Alibaba highlights, the Uniform P/E trades at 37.2x, which is above global average valuation levels and its historical average valuations.
High P/Es require high EPS growth to sustain them. In the case of Alibaba, the company has recently shown a 25% Uniform EPS growth.
Wall Street analysts provide stock and valuation recommendations that in general provide very poor guidance or insight. However, Wall Street analysts’ near-term earnings forecasts tend to have relevant information.
We take Wall Street forecasts for GAAP earnings and convert them to Uniform earnings forecasts. When we do this, Alibaba’s Wall Street analyst-driven forecast is a 7% Uniform EPS shrinkage in 2021 and a 20% growth in 2022.
Based on current stock market valuations, we can use earnings growth valuation metrics to back into the required growth rate to justify Alibaba’s $305 stock price. These are often referred to as market embedded expectations.
The company needs to grow its Uniform earnings by 14% each year over the next three years and to justify current stock prices. What Wall Street analysts expect for UnitedHealth’s earnings growth is below what the current stock market valuation requires in 2021, but above that requirement in 2022.
Furthermore, the company’s earning power is 20x the corporate average. Also, cash flows are 7x above their total obligations—including debt maturities and capex maintenance. Together, this signals low credit risk.
To conclude, Alibaba’s Uniform earnings growth is well below peer averages in 2020, but is trading well above average peer valuations.
Best regards,
Joel Litman & Rob Spivey
Chief Investment Strategist &
Director of Research
at Valens Research