
This fund is daring enough to invest well outside of its benchmark, and is being rewarded for it

The easiest path for any fund manager is to buy stocks within their benchmark. This is the best way to ensure the fund performance doesn’t surprise investors who expect performance to broadly match.
The fund managers willing to go against the grain and identify unique stocks can be rewarded with outperformance, if they do it well. Today’s fund has focused on identifying high-growth names and bucking the indexing trends of many of its peers.
In addition to examining the portfolio, we are including a deeper look into the fund’s largest current holding, providing you with the current Uniform Accounting Performance and Valuation Tearsheet for that company.
Investor Essentials Daily:
Friday Uniform Portfolio Analytics
Powered by Valens Research
The best way for a fund manager to not get fired is to limit their losses relative to their benchmark or index. This often leads to fund managers becoming “closet indexers.” In other words, their portfolio ends up looking very similar to the index they are tracking.
Managers then make minimal bets with a small percentage of their portfolio, hoping to capture some modest alpha. This limits the possibility of huge underperformance relative to the index. When the bets go right, they slightly outperform the index and have good marketing material for clients.
However, these clients are buying a poor facsimile of an index fund, with much higher fees.
Additionally, active management is rife with funds who underperform the market. We highlighted this fact when talking about legendary investor Jack Bogle a month ago.
Widespread underperformance is driven by the perverse incentives of the industry. A fund manager will not be fired for matching an index. However, they will be fired for making a big bet and having it backfire.
However, some managers are so confident in their abilities that they ignore the holdings of the index and chart their own course. One example is PRIMECAP.
PRIMECAP is an investment manager with many of its offerings co-managed with investing giant Vanguard. Despite its partnership with Vanguard, PRIMECAP has generated alpha by not being closet indexers.
One example of this is with the firm’s Odyssey Aggressive Growth Fund. The fund focuses on mid-cap names with potential for rapid earnings growth. Odyssey is looking for companies that will grow or improve profitability faster than current market valuations suggest.
This leads the firm to focus on many companies with little to no current GAAP income. These stocks are expanding at a rapid pace and investing money back into the business.
Currently, the fund has 33% of its portfolio in Health Care. The S&P 500 by comparison at just 14%.
The strategy has been working well for PRIMECAP so far. The aggressive growth fund has returned 13.2% annually since inception. That’s nearly 4% outperformance of the S&P 500, which returns 9.3% on average.
PRIMECAP’s focus on these growth at a reasonable price (GARP) companies have allowed it to generate alpha.
However, using as-reported metrics, there should be no reason these below average names would outperform the index.
In truth, these securities are strong performers once Uniform Accounting metrics are applied.
See for yourself below.
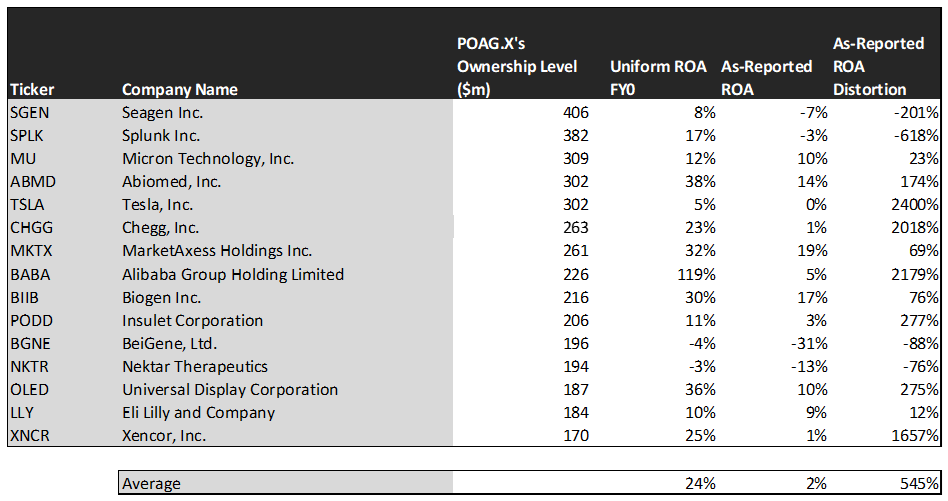
Using as-reported accounting, investors would think investing in high-growth names means sacrificing quality and returns.
On an as-reported basis, many of these companies are poor performers with returns at 0% or below, with the average as-reported return on assets (ROA) right around 2%.
In reality, the average company in the index displays an impressive average Uniform ROA of 24%.
Once we make Uniform Accounting (UAFRS) adjustments to accurately calculate earnings power, we can see the underlying strength of the portfolio. Once the distortions from as-reported accounting are removed, we can see Chegg (CHGG) does not have a return of 1%, but a sizable ROA of 23%.
Similarly, Seagen’s (SGEN) ROA is really 8%, not at -7%. While as-reported metrics are portraying the company as a negative return business, Uniform Accounting shows the company’s profitability.
The list goes on from there, for names ranging from Insulet (PODD) and Alibaba (BABA), to Universal Display Corporation (OLED), and Abiomed (ABMD).
If investors were to only look at as-reported metrics, they would assume PRIMECAP is investing in low-quality businesses.
Now, let us see how these firms’ returns can strengthen over time through EPS growth.

This chart shows three interesting data points:
- The 2-year Uniform EPS growth represents what Uniform earnings growth is forecast to be over the next two years. The EPS number used is the value of when we take consensus Wall Street estimates and we convert them to the Uniform Accounting framework.
- The market expected Uniform EPS growth is what the market thinks Uniform earnings growth is going to be for the next two years. Here, we show by how much the company needs to grow Uniform earnings in the next 2 years to justify the current stock price of the company. If you’ve been reading our daily analyses and reports for a while, you’ll be familiar with the term embedded expectations. This is the market’s embedded expectations for Uniform earnings growth.
- The Uniform EPS growth spread is the spread between how much the company’s Uniform earnings could grow if the Uniform earnings estimates are right, and what the market expects Uniform earnings growth to be.
The average company in the U.S. is forecast to have 5% annual Uniform Accounting earnings growth over the next 2 years. On the other hand, these top stocks are forecasted by analysts for 24% Uniform earnings growth.
On average, the market is pricing these companies to shrink earnings by 12% a year. This highlights that PRIMECAP is focused on companies projected to grow earnings much faster than the market is pricing.
One example of a company with high growth potential is Tesla (TSLA). While the market expects Tesla to grow by 42% over the next two years, analysts forecast the firm to see 174% growth over the same period.
Another company with similar dislocations is Universal Display. The company is forecast for Uniform EPS to grow by 26% a year, and the market is expecting the company to only grow EPS by 13%.
Yet another example is Eli Lilly (LLY). The company is cheap, as it is priced to grow Uniform earnings by just 8%, but the company is forecast to in fact grow its EPS by 26% in the next two years.
That being said, there are some companies forecast to have earnings growth less than market expectations. For these companies, like Splunk (SPLK), Abiomed, and Insulet, the market has growth expectations in excess of analysts’ predictions.
In conclusion, PRIMECAP has differentiated itself from competitors by ignoring the indexes. It invests in companies it expects to grow substantially regardless of sector. The largest companies in this fund possess high returns and growth projections above the markets expectations once we remove the as-reported distortions.
SUMMARY and Seagen Inc. Tearsheet
As one of PRIMECAP Odyssey Aggressive Growth Fund’s largest individual stock holding, we’re highlighting the tearsheet of Seagen Inc. (SGEN) today.
As the Uniform Accounting tearsheet for Seagen highlights, the Uniform P/E trades at 39.5x, which is above global average valuation levels and its own historical average valuations.
High P/Es require high EPS growth to sustain them. In the case of Seagen, the company has recently shown a 94% Uniform EPS growth.
Wall Street analysts provide stock and valuation recommendations that in general provide very poor guidance or insight. However, Wall Street analysts’ near-term earnings forecasts tend to have relevant information.
We take Wall Street forecasts for GAAP earnings and convert them to Uniform earnings forecasts. When we do this, Seagen’s Wall Street analyst-driven forecast is a 178% and 22% Uniform EPS growth in 2020 and 2021, respectively.
Based on the current stock market valuations, we can use earnings growth valuation metrics to back into the required growth rate to justify Seagen’s $197 stock price. These are often referred to as market embedded expectations.
In order to justify current stock prices, the company would need to have Uniform earnings grow by 42% per year over the next three years. What Wall Street analysts expect for Seagen’s earnings growth is well above what the current stock market valuation requires in 2020, but below this requirement in 2021.
Furthermore, the company’s earning power is around the corporate average. However, cash flows and cash on hand are nearly 5x their total obligations—including debt maturities and capex maintenance. Together, this signals low credit risk.
To conclude, Seagen’s Uniform earnings growth is well above peer averages in 2020, and it is also trading well above average peer valuations.
Best regards,
Joel Litman & Rob Spivey
Chief Investment Strategist &
Director of Research
at Valens Research


