
This fund returned 83% in the last year, and its successful track record could tip us off to the biggest names in tech for 2021

Investing in the tech industry can be lucrative, but only for the savviest investors. Industry knowledge and a rigorous investment philosophy are critical to avoid getting burned.
Today’s highlighted fund was founded by an investor who has been taught by some of the industry’s best tech investors.
Today, we dive deeper into the fund’s portfolio and investment processes.
Investor Essentials Daily:
Friday Uniform Portfolio Analytics
Powered by Valens Research
Investing in technology has always been a challenge for investors. It’s difficult to get all the pieces right at the same time.
One cause for this challenge is the rapid innovation cycle for technology. Faster than any other industry, winners and losers are created and destroyed, thanks to the speed at which innovation takes place.
Additionally, there is a high bar for industry knowledge and expertise to understand the market. Without understanding the intrinsic worth of the technology, an investor can’t even begin to value a name. As challenging as it is, understanding the overall marketplace is critical.
Those who have tremendous experience in the area know to spend their time on trying to find ways to simplify the dazzling amount of noise in the sector. They focus on heuristics of how these technology business models tend to emerge and repeat.
The “S Curve” has proven to be an industry favorite.
The S Curve is a model for mapping how companies or industries emerge and create immense value for investors. Being able to understand the S Curve and these various cycles can set many investors aside from their competition.
The logic behind the S Curve is that growth in new industries can be exponential, not always linear.
Often, a new technology can be invested or theorized, yet it only catches on five years later. At this early part of the S Curve, growth is relatively flat.
Then, as R&D pays off for companies, the price for the product drops or the technology catches up to make it easier for people to adopt it. This creates huge growth opportunities, as new addressable markets are discovered and unmet needs are filled.
Then, as consumers learn about the product and the market becomes saturated, growth begins to slow for the mature market.
Advancements in traditional markets such as railroads or air conditioning took 50 years to penetrate. This process may only last a few years in tech, leaving names like Betamax, Yahoo, and Blackberry behind before investors know what happened.
If investors don’t catch the adoption in time, or if they buy in too early, they can get burned badly. This is why investors spend most of their time analyzing and timing the “growth” part of the S Curve. This area is where tremendous value can be generated.
One investor who has had decades of unparalleled experiences locating this part of the curve is Alex Sacerdote. He learned the ropes of investing in e-commerce and technology at Fidelity. He even spent time learning how to think like a tech analyst from investment legends like Peter Lynch.
Sacerdote founded his own shop, Whale Rock Capital Management, in 2006. Here, he focuses the majority of his time and investments in the tech world. In addition, Whale Rock understands where and when business cycle shifts are taking place.
Whale Rock has become impressive through timing the balance of its investments. Through this expertise, Sacerdote is able to position the fund in front of these cycles in companies before they take off. Meanwhile, they have also been able to avoid getting into companies so early as to hold dead money.
However, on an as-reported basis, many of his top picks in his fund do not look like they are going through an inflection.
This perception comes from as-reported accounting distorting the true nature of these companies. To show why investors cannot trust as-reported accounting, we’ve conducted a portfolio audit of Whale Rock’s top equity holdings.
Below is a summarized and abbreviated analysis of how we work with institutional investors to analyze their portfolios.
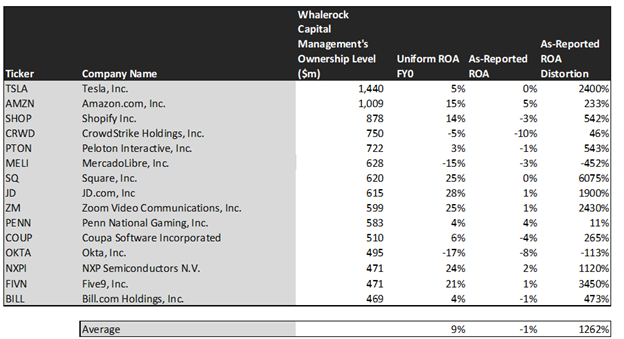
Using as-reported accounting, investors might think Whale Rock invests in low-quality tech companies. In reality, the fund sees through the accounting noise to pick up names markets are completely misunderstanding, often because of accounting issues.
On an as-reported basis, many of these companies are poor performers with returns below 5%-6%, with the average as-reported ROA around negative 1%.
Once we make Uniform Accounting (UAFRS) adjustments to accurately calculate earning power, we can see that the returns of the companies in Whale Rock’s portfolio are much more robust.
The average company in the portfolio displays an impressive average Uniform return on assets (ROA) at 9%.
Once the distortions from as-reported accounting are removed, we can see NXP Semiconductors (NXPI) doesn’t have a 2% ROA, it has returns of 24%. NXP isn’t a low-return distressed company. It is a company with robust cash flows Whale Rock thinks is misunderstood by equity investors.
Similarly, Square’s (SQ) ROA is really 25%, not 0.4%. Whale Rock’s focus on better accounting and credit analytics recognizes a high return business with cash flows to handle obligations.
JD.com (JD) is another great example of as-reported metrics mis-representing the company’s profitability.
JD’s ROA isn’t 1%, it’s actually 28%. Uniform Accounting lines up with Whale Rock’s decision making, as JD is in reality a high return business.
The list goes on from there, for names ranging from Five9 (FIVN) and Shopify (SHOP), to Zoom Video (ZM) and Coupa Software (COUP).
If Whale Rock’s investment strategy was powered by as-reported metrics, it would never pick most of these companies, because they look like companies that are either poor performers or still in the early adopter phase of their specific products.
To find companies poised for the growth part of the S Curve, just finding companies where as-reported metrics mis-represent a company’s real profitability is insufficient.
To really generate alpha, any investor also needs to identify where the market is significantly undervaluing the company’s potential.
Whale Rock is also investing in companies that the market has low expectations for, low expectations the companies can exceed.

This chart shows three interesting data points:
- The 2-year Uniform EPS growth represents what Uniform earnings growth is forecast to be over the next two years. The EPS number used is the value of when we take consensus Wall Street estimates and we convert them to the Uniform Accounting framework.
- The market expected Uniform EPS growth is what the market thinks Uniform earnings growth is going to be for the next two years. Here, we show by how much the company needs to grow Uniform earnings in the next 2 years to justify the current stock price of the company. If you’ve been reading our daily analyses and reports for a while, you’ll be familiar with the term embedded expectations. This is the market’s embedded expectations for Uniform earnings growth.
- The Uniform EPS growth spread is the spread between how much the company’s Uniform earnings could grow if the Uniform earnings estimates are right, and what the market expects Uniform earnings growth to be.
The average company in the U.S. is forecast to have 5% annual Uniform Accounting earnings growth over the next 2 years. Whale Rock’s holdings are forecast by analysts to grow by 135%.
Even better, the market is only pricing these companies to grow earnings by 40% a year on average. While these companies are priced to grow faster than the market, they are intrinsically undervalued, as the market is mispricing their growth by a whopping 94%.
These are the kinds of companies that are likely to see their stocks rally when the market realizes the potential S Curve of profitability.
One example of a company in the Whale Rock portfolio that has growth potential that the market is mispricing is Coupa Software (COUP). Coupa’s analyst forecasts have 708% Uniform earnings growth built in, but the market is only pricing the company to have earnings growth of 99% each year for the next two years.
Another company with similar dislocations is Okta, Inc. (OKTA). This might look like a company Whale Rock is misunderstanding, with low market expectations.
Market expectations call for a 264% shrinkage in earnings. However, the company is actually forecast for Uniform EPS to only shrink by 19% a year. OKTA simply has to overcome these dour expectations to see upside.
Yet another is the fund’s largest holding. Tesla (TSLA) is priced for a 108% expansion in Uniform earnings, when they are forecast to grow earnings by 219% a year.
That being said, for names like Square (SQ) or Penn National Gaming (PENN), analyst expectations were for smaller EPS growth than market expectations.
These could be a case where investors miss what Uniform Accounting is picking up on. Another possibility may be Whale Rock might be betting on specific events for the company that make earnings forecasts less relevant.
For the most part, Whale Rock’s holdings are high quality, undervalued names displaying strong earning power. This wouldn’t be clear under GAAP, but unsurprisingly, Uniform Accounting and a system built to deliver alpha see the same signals.
Tesla Tearsheet
As Whale Rock’s largest individual stock holding, we’re highlighting Tesla’s tearsheet today. Uniform Accounting tearsheet for Tesla, Inc. (TSLA) highlights Tesla’s Uniform P/E trades at 186.0x, which is above corporate average valuation levels and its historical valuations.
High P/Es require High EPS growth to sustain them. In the case of Tesla, the company has recently shown a 17% Uniform EPS shrinkage.
Wall Street analysts provide stock and valuation recommendations that in general provide very poor guidance or insight. However, Wall Street analysts’ near-term earnings forecasts tend to have relevant information.
We take Wall Street forecasts for GAAP earnings and convert them to Uniform earnings forecasts. When we do this, Tesla’s Wall Street analyst-driven forecasts are 2% and 105% EPS growth in 2021 and 2022, respectively.
Based on current stock market valuations, we can back into the required earnings growth rate that would justify $846 per share. These are often referred to as market embedded expectations.
In order to meet the current market valuation levels of Tesla, the company would have to have Uniform earnings grow by 109% each year over the next three years. What Wall Street analysts expect for Tesla’s earnings growth is much better than what the current stock market valuation requires.
Furthermore, the company’s earning power is below its corporate average. Also, cash flows and cash on hand are 3x its total obligations—including debt maturities, capex maintenance, and dividends. Together, this signals a low credit and dividend risk.
To conclude, Tesla’s Uniform earnings growth is below its peer averages, while their valuations are traded above its average peers.
Best regards,
Joel Litman & Rob Spivey
Chief Investment Strategist &
Director of Research
at Valens Research


